

Paper Sharing
【Domestic Papers】Carbon‐Doped Amorphous Gallium Oxide Forms a Heterojunction With Water to Improve the Electrocatalytic Oxygen Evolution Reaction
日期:2026-05-09阅读:55
Researchers from the Sun Yat‐sen University and Wenzhou University have published a dissertation titled "Carbon‐Doped Amorphous Gallium Oxide Forms a Heterojunction With Water to Improve the Electrocatalytic Oxygen Evolution Reaction" in Carbon Energy.
Background
Hydrogen production by water electrolysis is a key green hydrogen technology for achieving carbon neutrality. The slow kinetics of the oxygen evolution reaction (OER) is the core bottleneck for electrolysis efficiency. Traditional noble metal catalysts are costly and scarce, while non‑noble metal nanocatalysts suffer from dissolution and agglomeration during large‑scale preparation, leading to a sharp decline in stability. Gallium oxide (Ga₂O₃) exhibits high stability, but its powder form requires the addition of binders, resulting in weak interaction with the support and difficulty in precise control of interfacial activity. Amorphous gallium oxide is rich in low‑coordination active sites, and atomic layer deposition (ALD) enables self‑limiting growth of amorphous films with strong metal‑support interaction (SMSI), providing a new route toward efficient and stable OER catalysts.
Abstract
The weak interactions between powdered catalysts and their supports significantly impact the kinetics of the water electrolysis oxidation reaction. Here, we use plasma‐enhanced atomic layer deposition (PEALD) technology to directly construct amorphous carbon‐doped gallium oxide (ACG) on a glassy carbon (GC) electrode with trimethylgallium (TMGa) and oxygen plasma as oxygen sources. The technique has low saturation pulse periods for the TMGa precursor, a wide temperature range (75°C–300°C), and a steady growth rate of 0.65 Å / cycle. Carbon atom doping induces localized electric fields within the ACG, enhancing the kinetics of the water electrolysis reaction. In addition, electron paramagnetic resonance spectroscopy and theoretical calculations show that ACG forms a catalyst–water–heterojunction structure with water molecules, which promotes the formation of hydroxyl radicals, thus revealing the active origin of GaOOH. Importantly, under the strong oxidizing effect of hydroxyl radicals, carbonate is easily formed, and a weak alkaline layer is formed at the interface of the catalyst, which prevents continuous reconstruction of the GaOOH phase, thus improving the stability of the catalyst in complex media. Meanwhile, it is revealed that ACG follows the lattice oxygen mechanism (LOM) in the oxygen evolution reaction process. Results indicate that achieving a current of 1000 mA cm⁻² in an alkaline seawater medium requires only 1.94 V, with stable operation for 200 h showing virtually no attenuation. This study demonstrates the ability to manufacture thin films via PEALD, paving the path toward enhanced electrocatalytic applications.
Highlights
Amorphous carbon-doped gallium oxide (ACG) films are directly prepared on glassy carbon electrodes by PEALD technology, with a wide deposition temperature window (75–300°C) and stable and controllable growth rate.
Carbon doping induces local electric fields, optimizes the electronic structure, reduces the band gap from 4.8 eV to 2.46 eV, and significantly improves conductivity and reaction kinetics.
The catalyst-water heterojunction (CWH) structure is proposed for the first time, which promotes the generation of hydroxyl radicals and reveals the active source of GaOOH.
In-situ formation of weak alkaline carbonate layer at the interface inhibits excessive reconstruction of GaOOH and greatly improves stability in complex media.
ACG follows the lattice oxygen mechanism (LOM), requiring only 1.94 V for 1000 mA cm⁻² in alkaline seawater with no attenuation after 200 h operation.
Conclusion
β-Ga₂O₃ thin films were fabricated via PEALD using TMGa and O₂ plasma as precursors. The process showed a broad ALD window ranging from 75°C–300°C, with a stable GPC of approximately 0.65 Å/cycle. XRD, XPS, and TEM results confirmed the successful formation of amorphous C‐doped β-Ga₂O₃ (ACG). Electrochemical measurements demonstrated that the ACG films deposited on GC showed excellent OER catalytic activity, achieving a current density of 10 mA cm⁻² at a low overpotential of only 340 mV, along with outstanding intrinsic catalytic activity and cycling stability. In addition, EPR and theoretical calculations show that the ACG catalyst forms a CWH structure with H₂O molecules, which promotes the formation of ·OH, thus revealing the active origin of GaOOH. C atom doping induces localized electric fields within the ACG, enhancing the kinetics of the H₂O electrolysis reaction. Importantly, under the strong oxidizing effect of ·OH, CO₃²⁻ is easily formed, and a weak alkaline layer is formed at the interface of the catalyst, thus improving the stability of the catalyst in complex media. Meanwhile, it is revealed that ACG follows the LOM mechanism in the OER process, which prevents continuous reconstruction of the GaOOH phase. This plasma‐assisted strategy for directly preparing catalytically active ACG thin films holds significant promise for applications in the field of renewable energy conversion.
Project Support
This research was financially sponsored by the Natural Science Foundation of China (Grant/Award Number: 52572112) and Baima Lake Laboratory Joint Funds of the Zhejiang Provincial Natural Science Foundation of China (Grant/Award Number: LBMHZ24B060006).
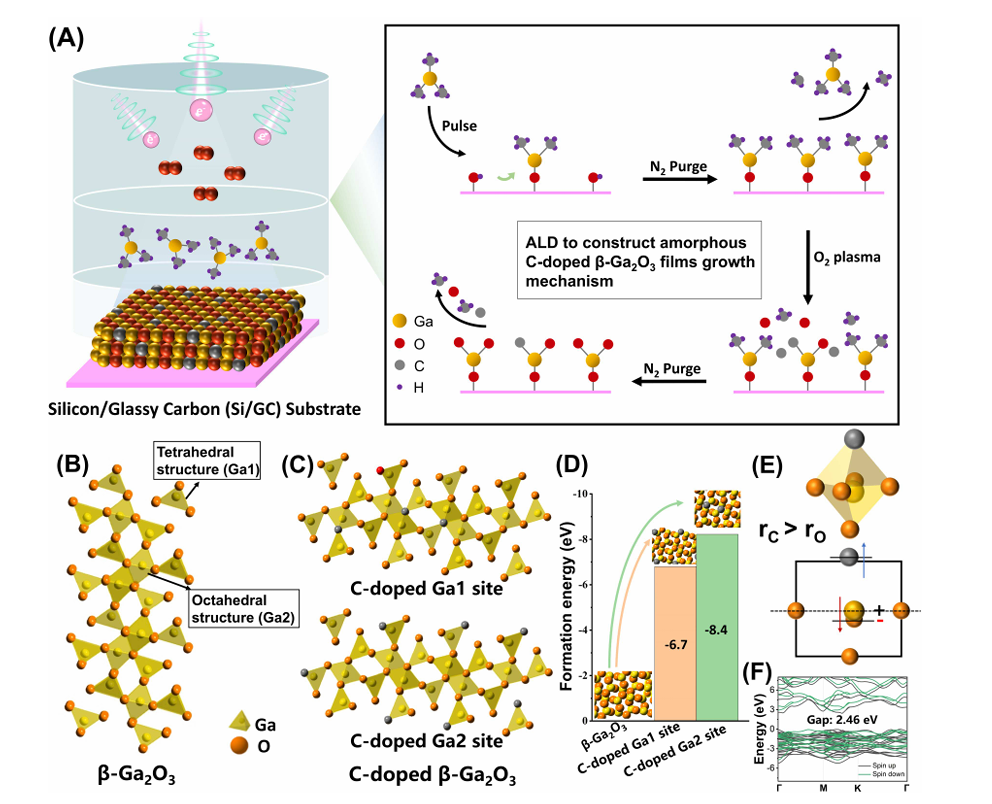
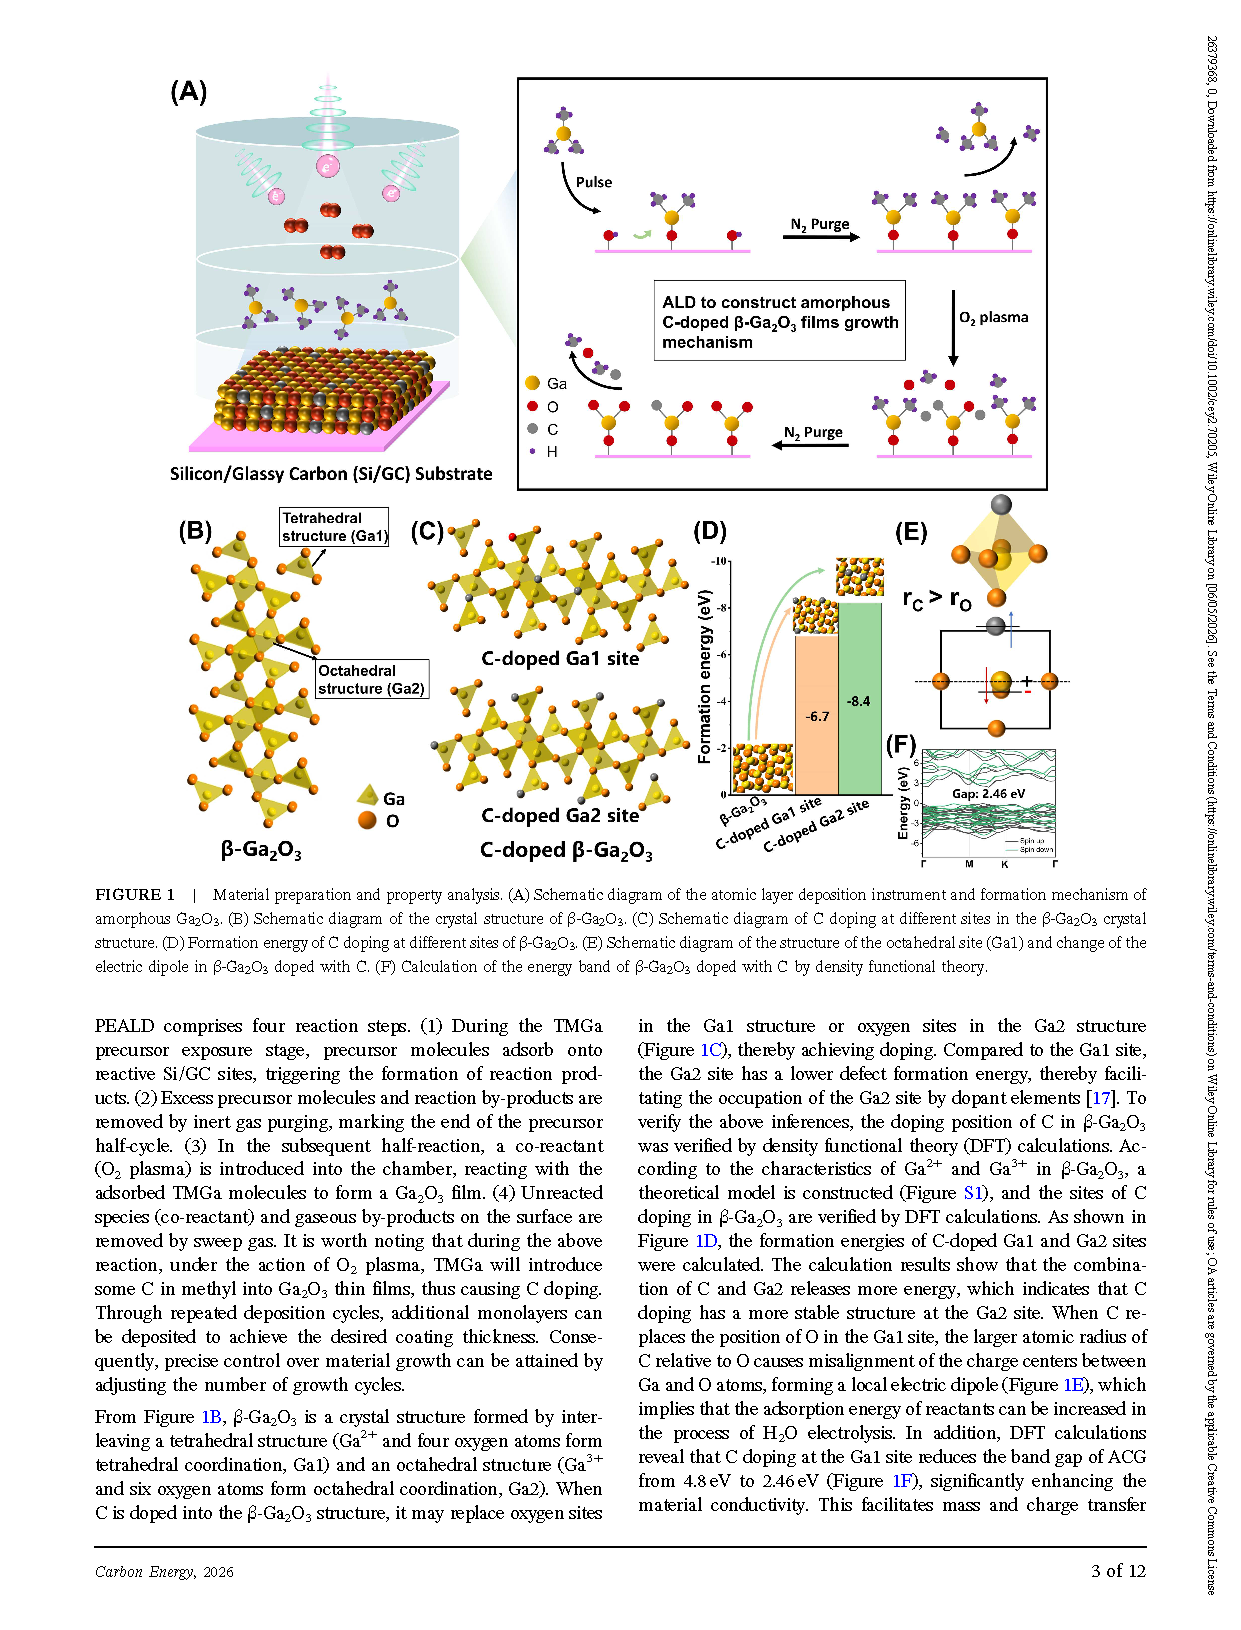
Figure 1 Material preparation and property analysis. (A) Schematic diagram of the atomic layer deposition instrument and formation mechanism of amorphous Ga₂O₃. (B) Schematic diagram of the crystal structure of β-Ga₂O₃. (C) Schematic diagram of C doping at different sites in the β-Ga₂O₃ crystal structure. (D) Formation energy of C doping at different sites of β-Ga₂O₃. (E) Schematic diagram of the structure of the octahedral site (Ga1) and change of the electric dipole in β-Ga₂O₃ doped with C. (F) Calculation of the energy band of β-Ga₂O₃ doped with C by density functional theory.
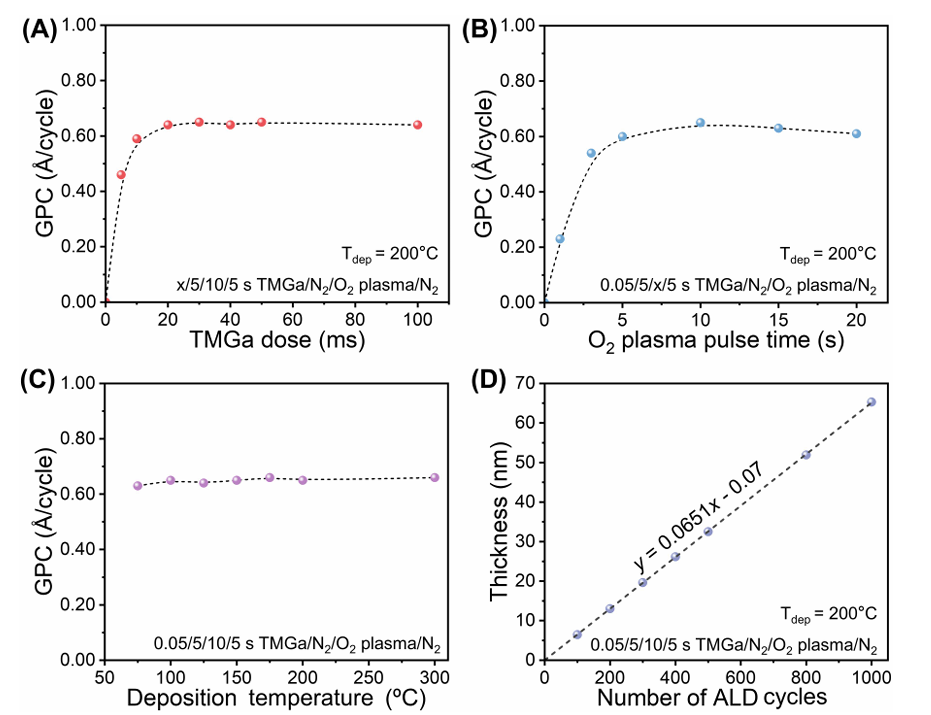
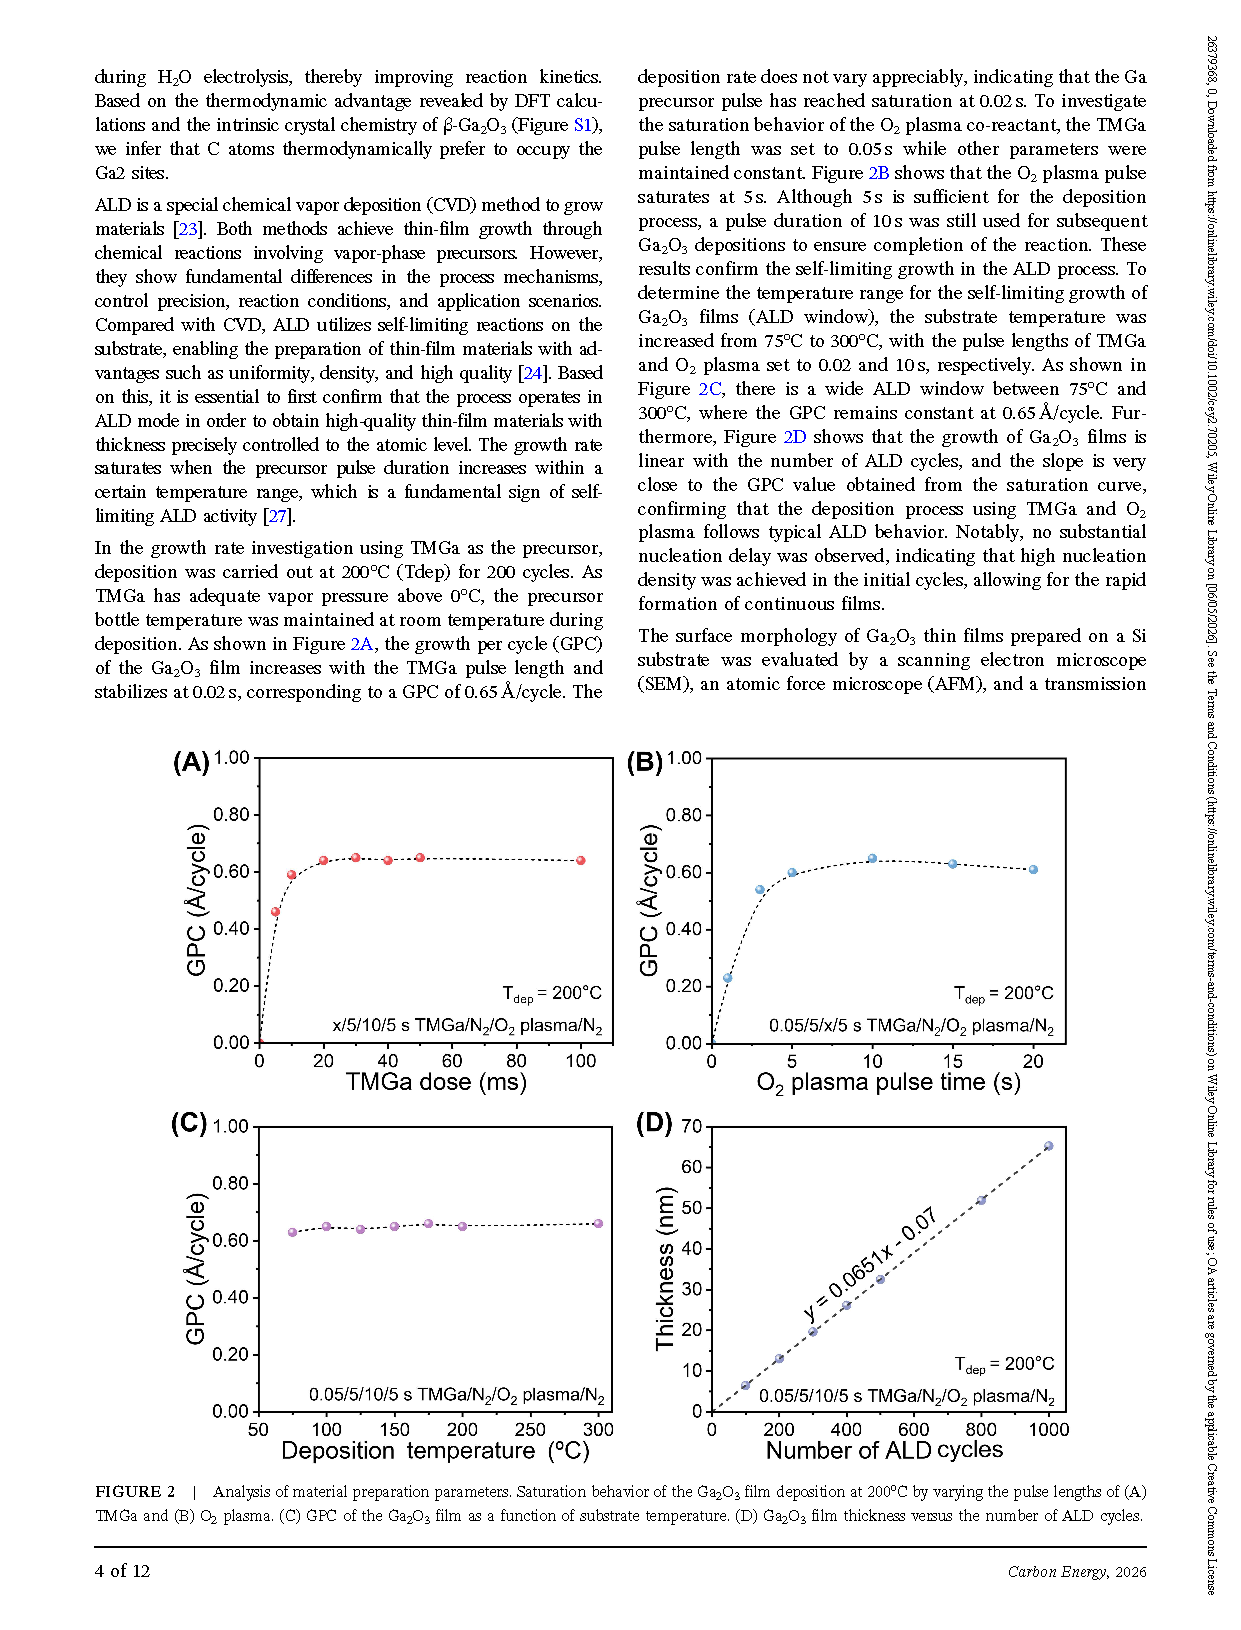
Figure 2 Analysis of material preparation parameters. Saturation behavior of the Ga₂O₃ film deposition at 200°C by varying the pulse lengths of (A) TMGa and (B) O₂ plasma. (C) GPC of the Ga₂O₃ film as a function of substrate temperature. (D) Ga₂O₃ film thickness versus the number of ALD cycles.
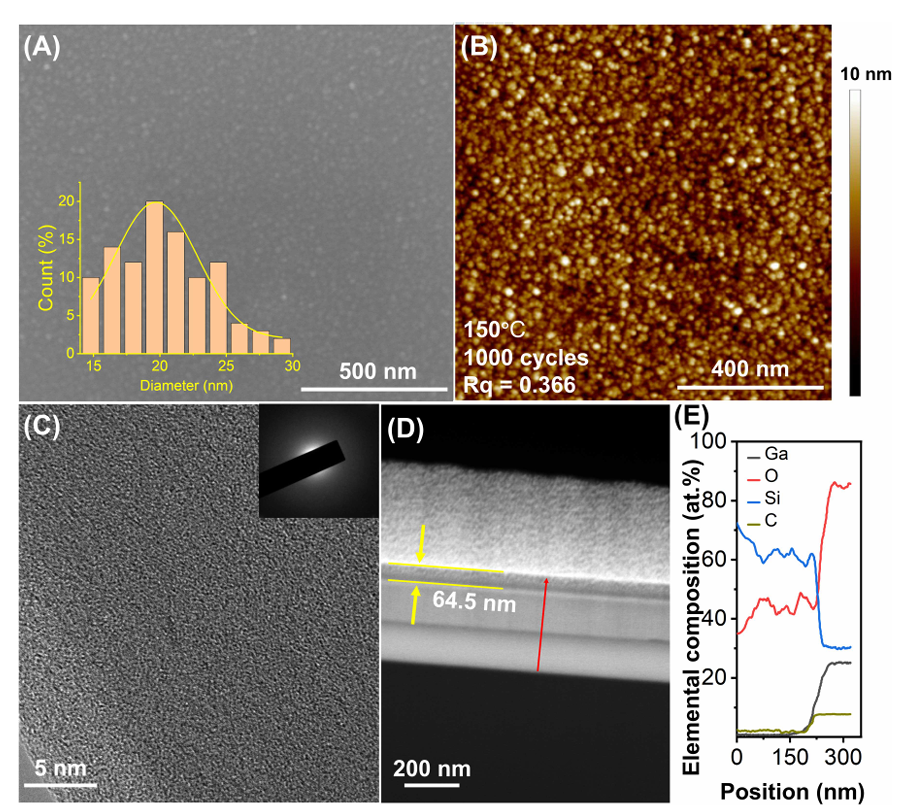
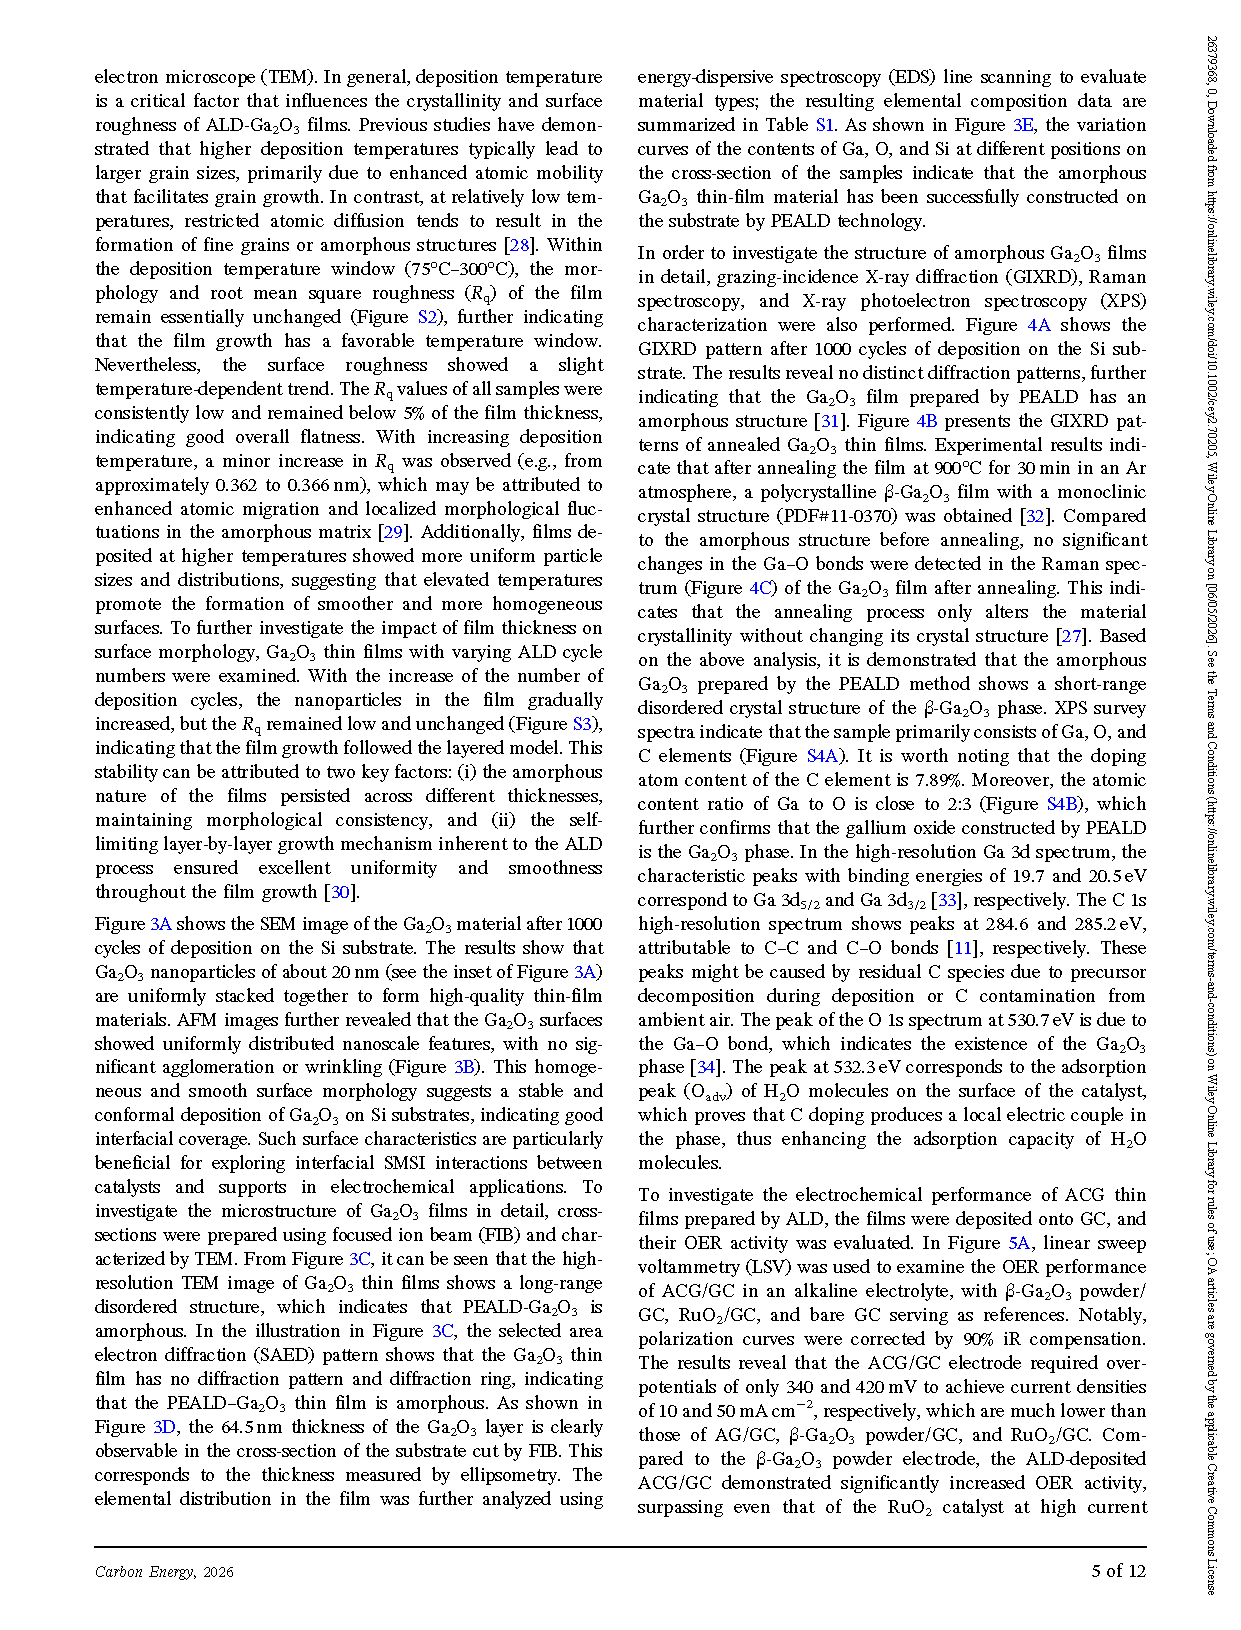
Figure 3 Material morphology analysis. (A) SEM, (B) AFM, and (C) TEM images of materials deposited on a Si substrate. The illustration in (A) shows the statistical graph of Ga₂O₃ particle size. The illustration in (C) shows a selected area electron diffraction (SAED) pattern from the same flake. (D) TEM images of cross-section and (E) linear scanning elemental analysis curves of the cross-section of Ga₂O₃ thin films deposited. The above analysis is based on the deposition of Ga₂O₃ thin films by PEALD for 1000 cycles.
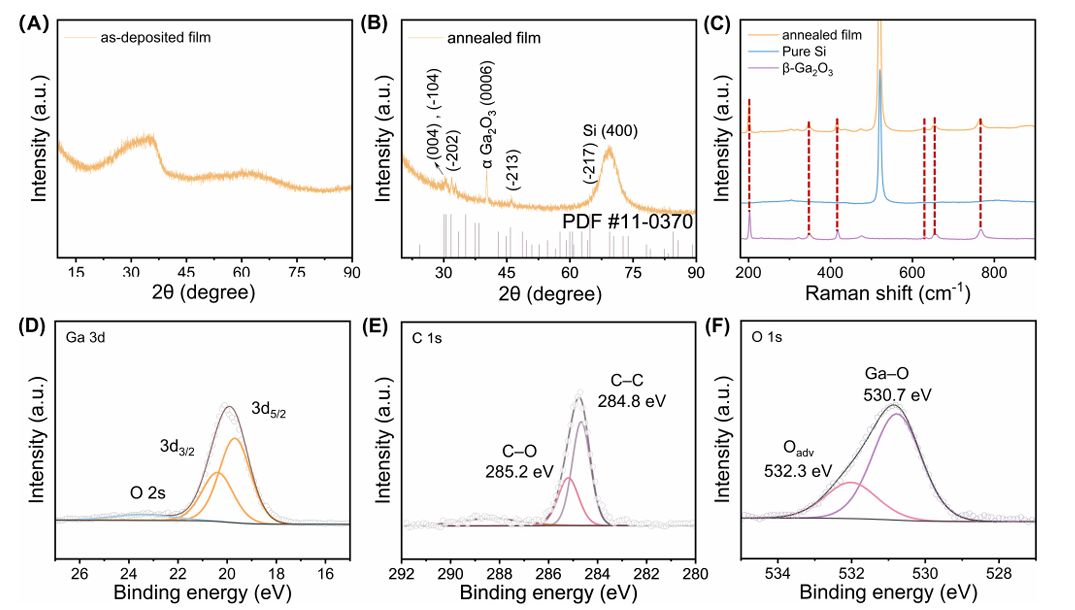
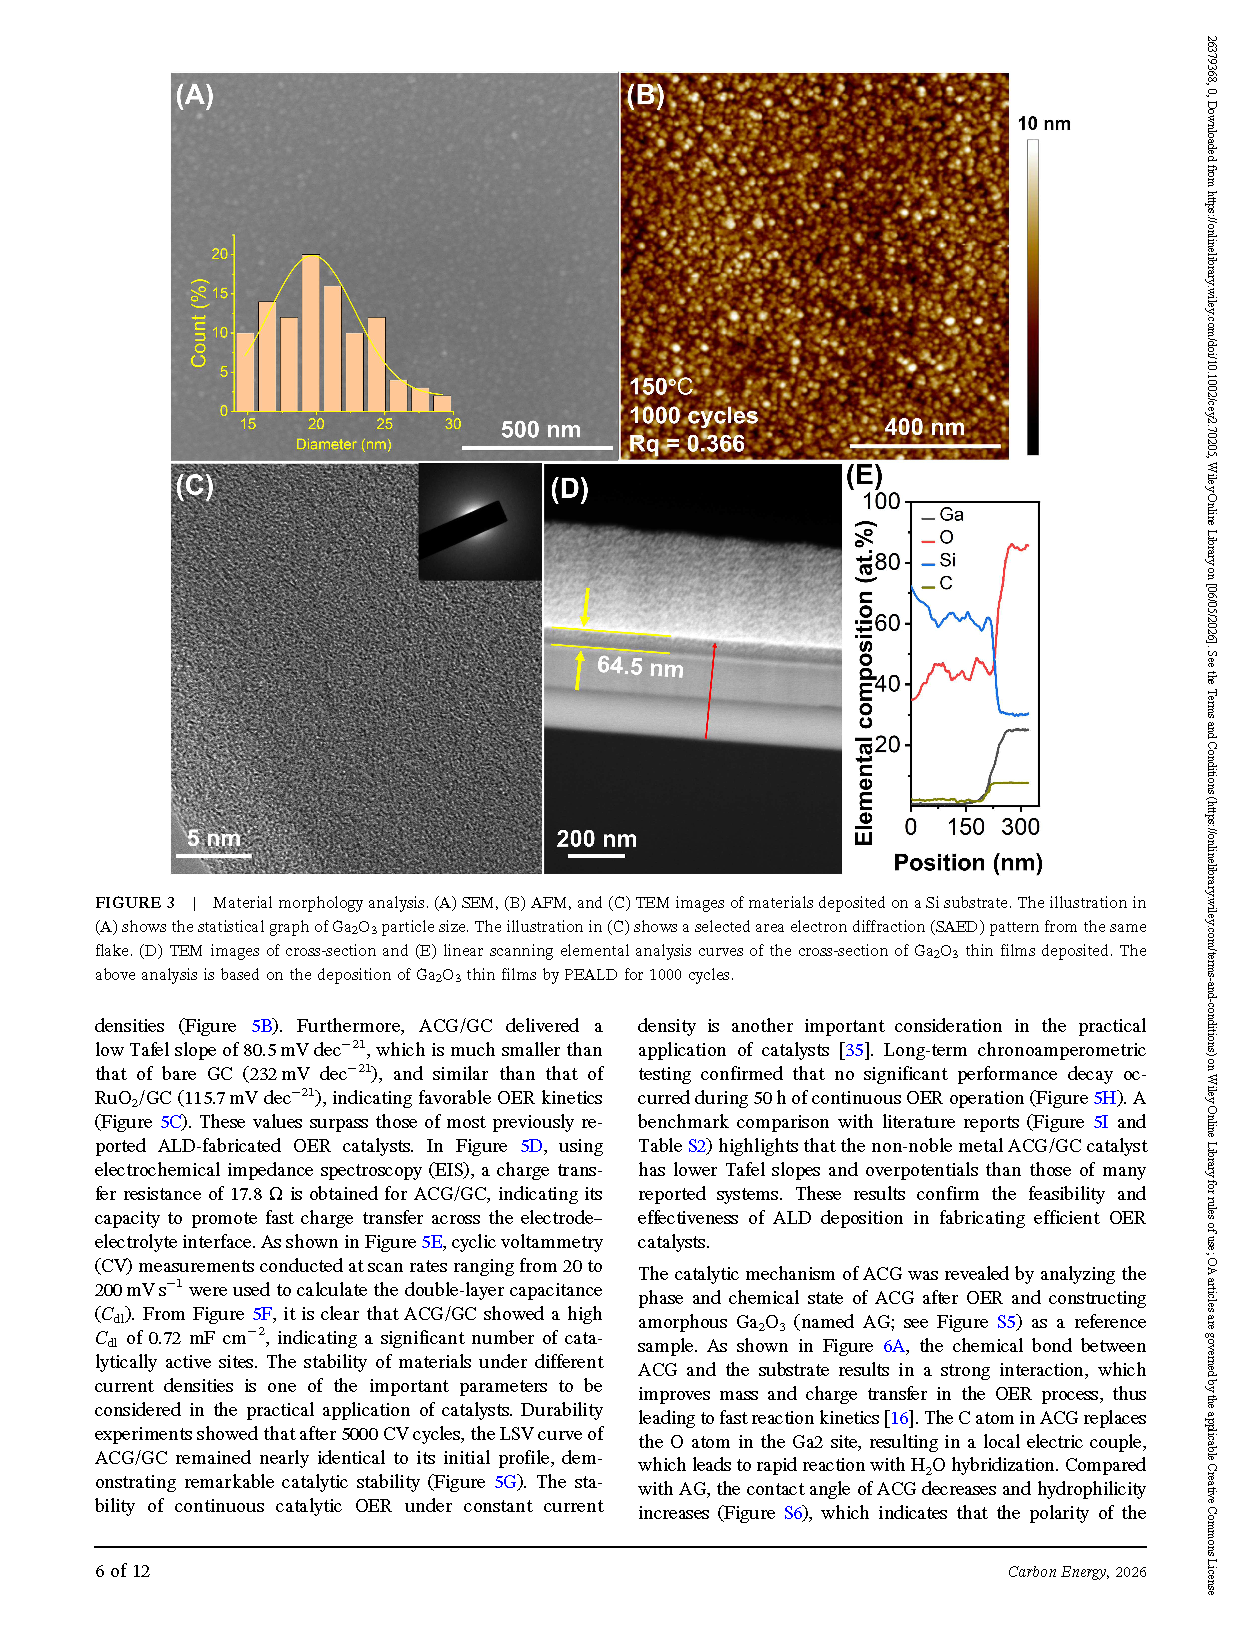
Figure 4 GIXRD patterns of (A) as-deposited and (B) annealed Ga₂O₃ thin films with a thickness of approximately 65 nm (1000 cycles). (C) Raman spectra of an annealed film. High-resolution XPS spectrum of an as-deposited film: (D) Ga 3d, (E) C 1s, and (F) O 1s.
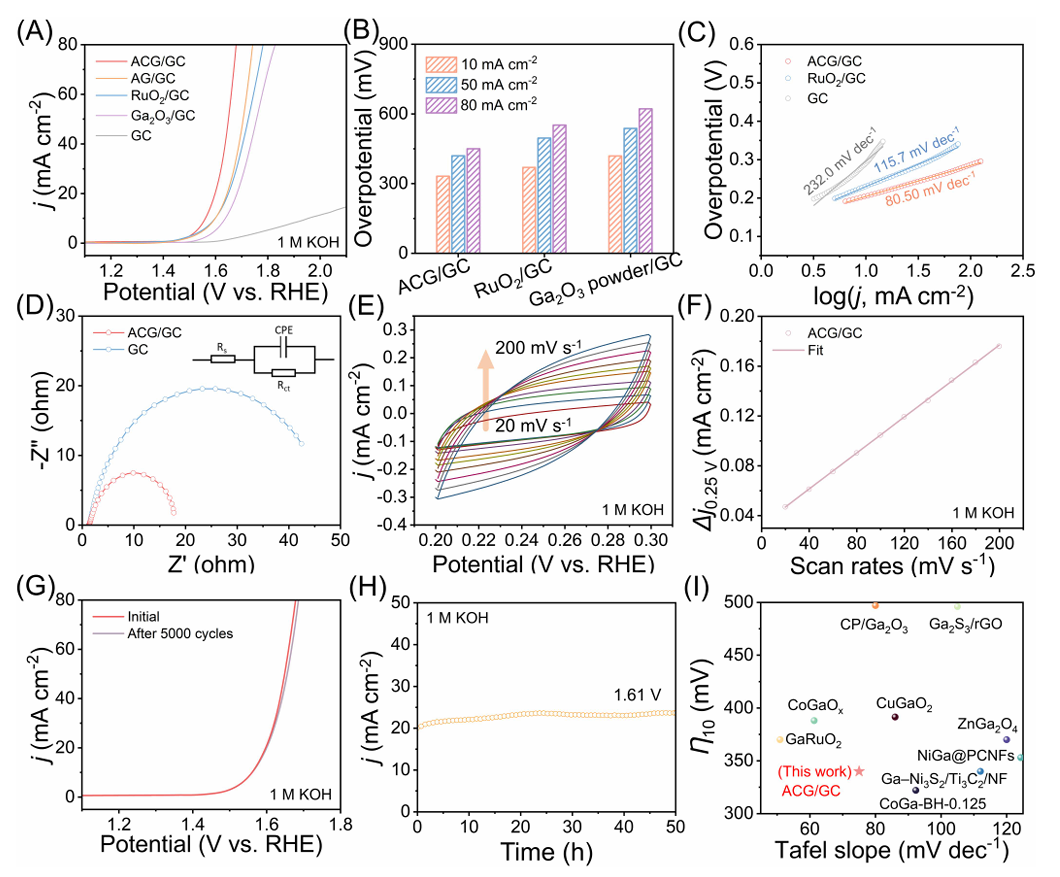
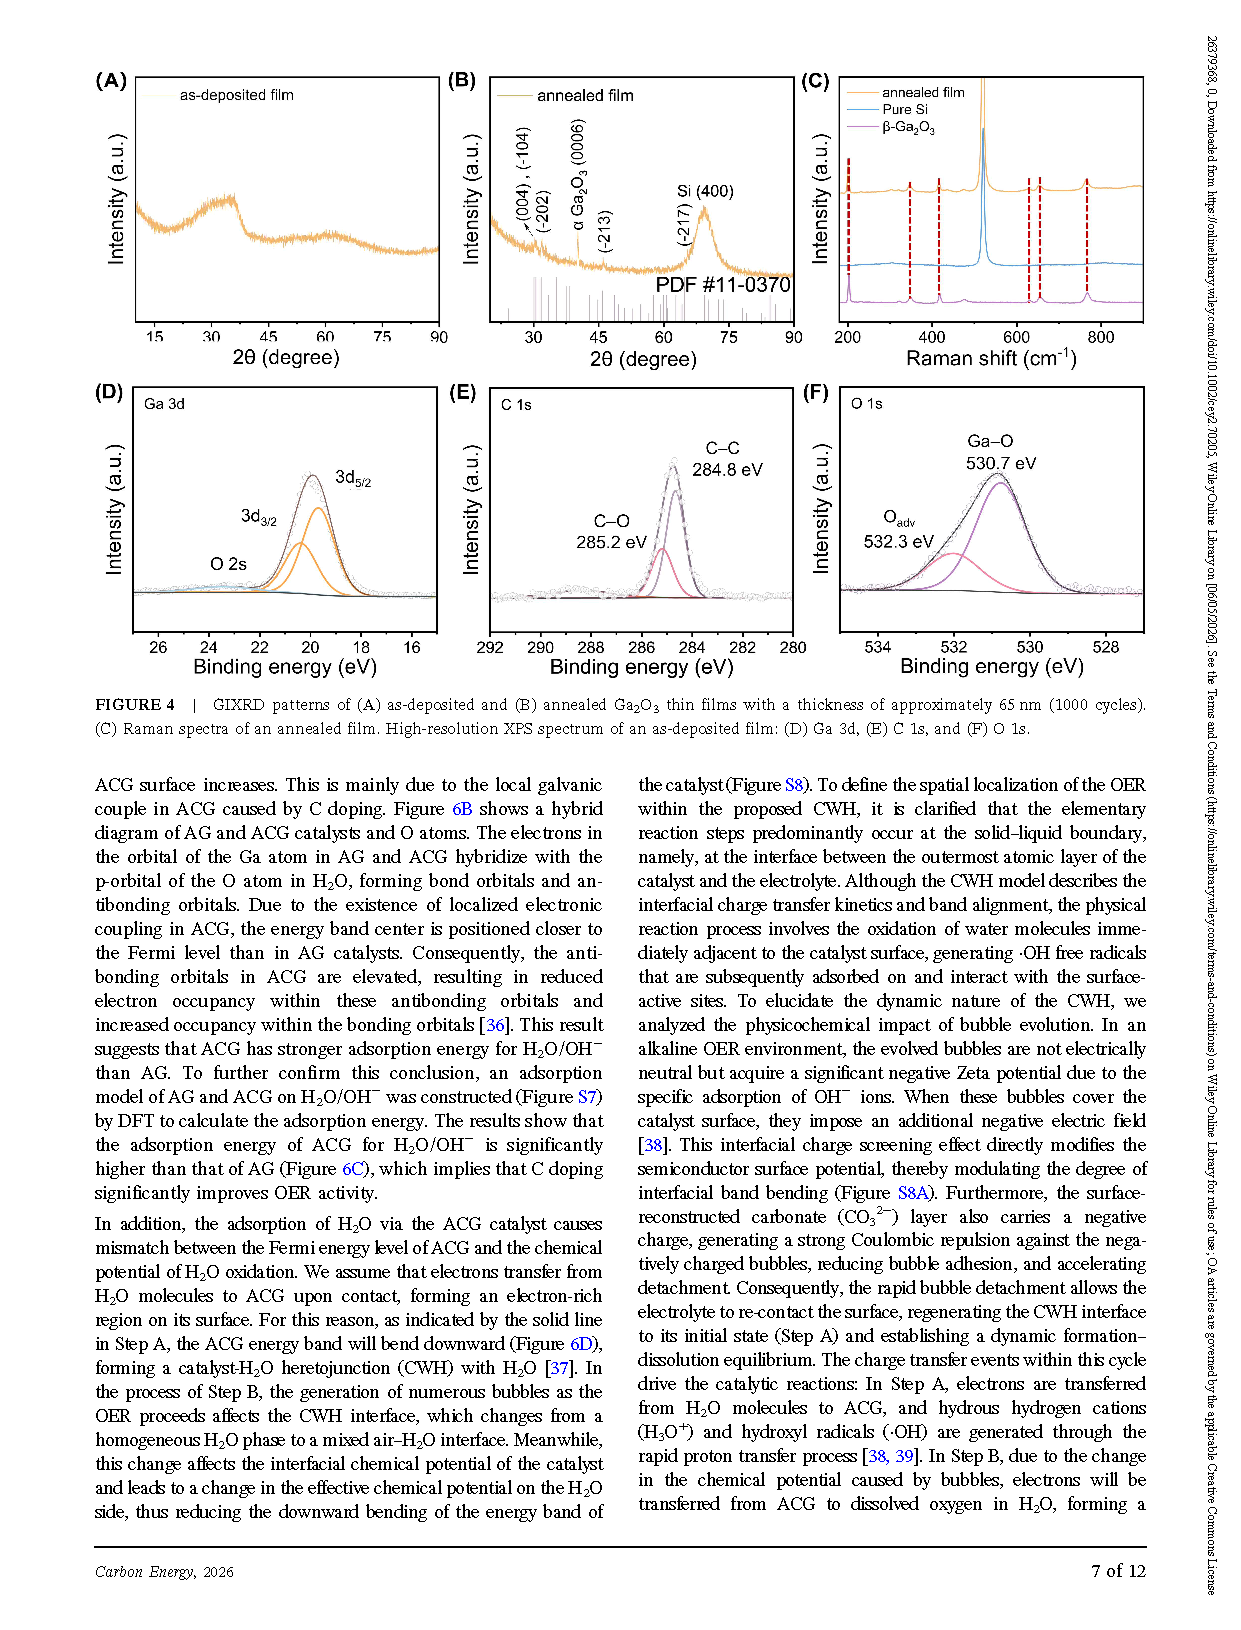
Figure 5 Catalytic performances for OER. (A) Polarization curves. (B) Overpotentials at current densities of 10, 50, and 80 mA cm⁻² (C) Corresponding Tafel plots. (D) EIS measurements. (E) Capacitive current at 0.25 V versus RHE as a function of the scan rate for ACG/GC. (F) Current density as a function of the scan rate at 0.25 V. (G) LSV curves of ACG/GC before and after CV cycling. (H) Long-term OER stability of ACG/GC. (I) Comparison of ALD-fabricated catalysts for OER.
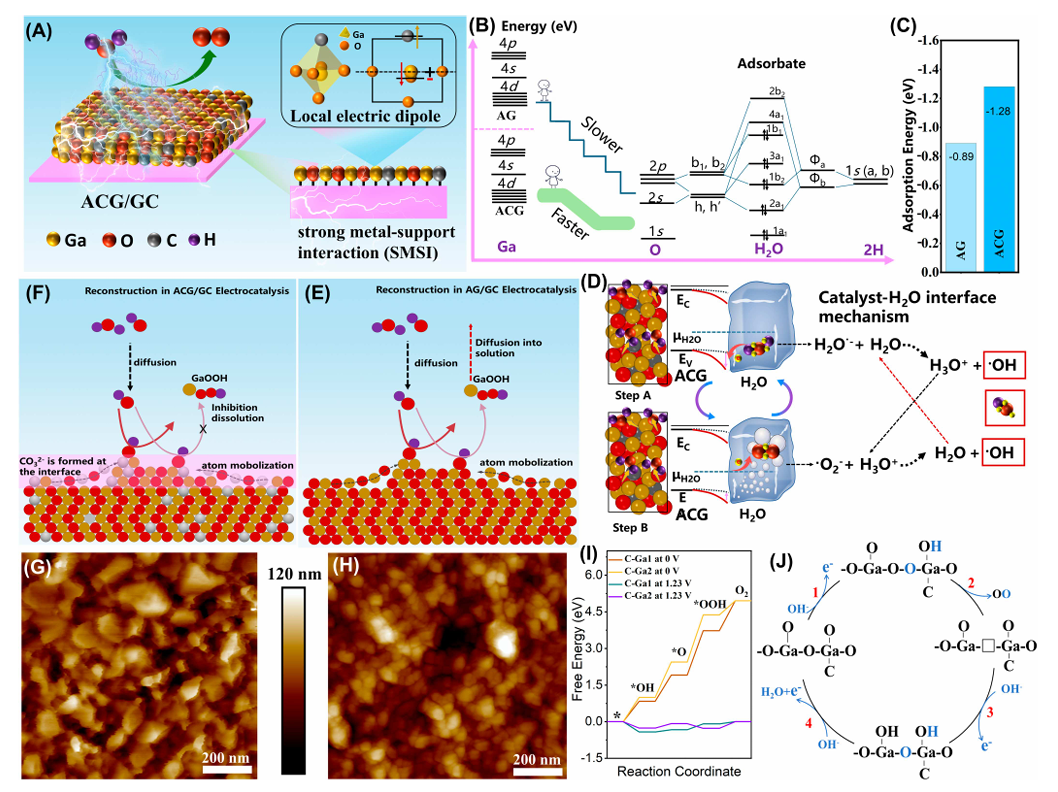
Figure 6 Analysis of the catalytic mechanism. (A) Schematic diagram of the SMSI interaction mechanism between the catalyst and the substrate. (B) Diagram of hybridization between catalysts of AG and ACG and O atoms of a H₂O molecule. (C) Histogram of the adsorption energy of various catalysts in reactants. (D) Schematic diagram of the interaction mechanism between an ACG catalyst and a H₂O molecule. Schematic diagram of surface interface analysis of (E) AG and (F) ACG catalysts after 50 h of continuous OER. AFM analysis of (G) AG and (H) an ACG catalyst after 50 h of continuous OER. (I) Free-energy diagrams for C–Ga2 and C–Ga1 at U=0 and 1.23 V. (J) Schematic diagram of the pathway of the electrocatalytic OER mechanism.
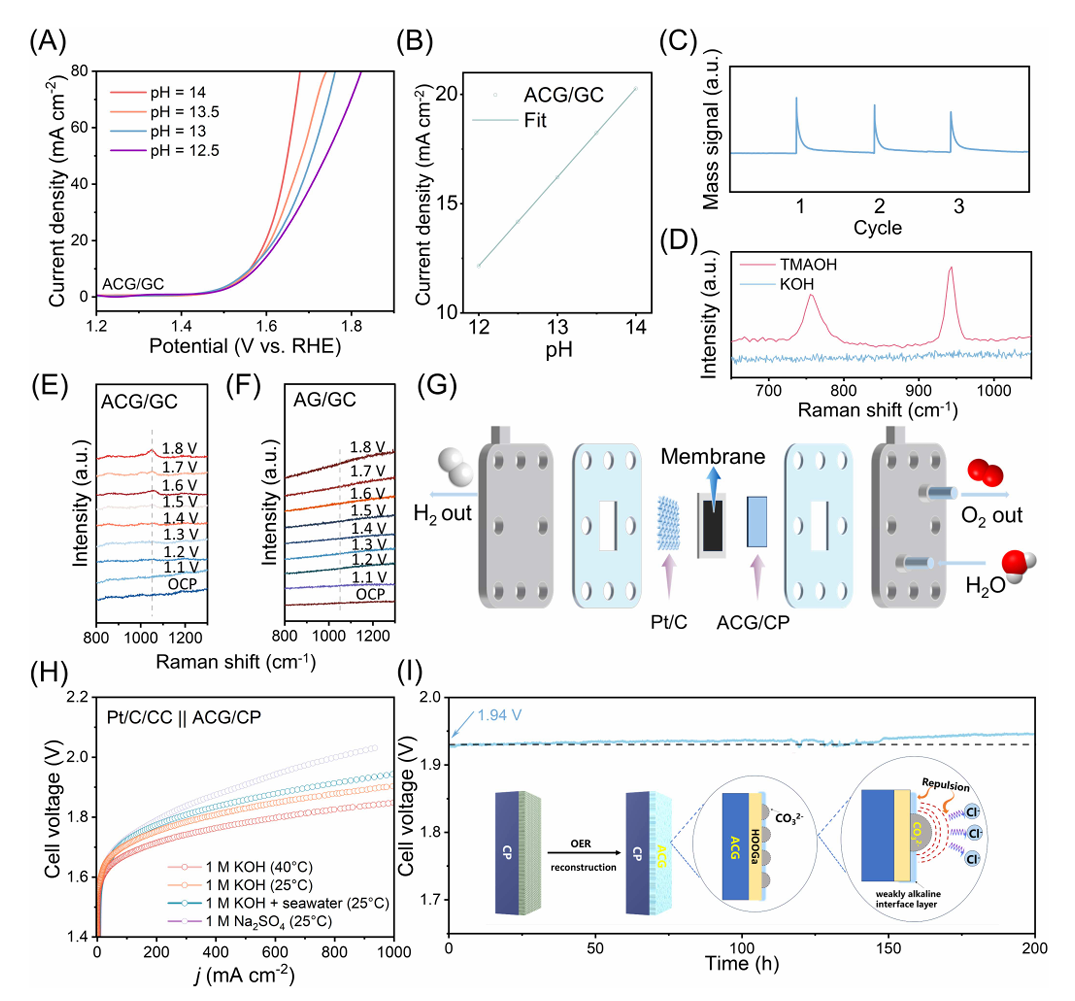
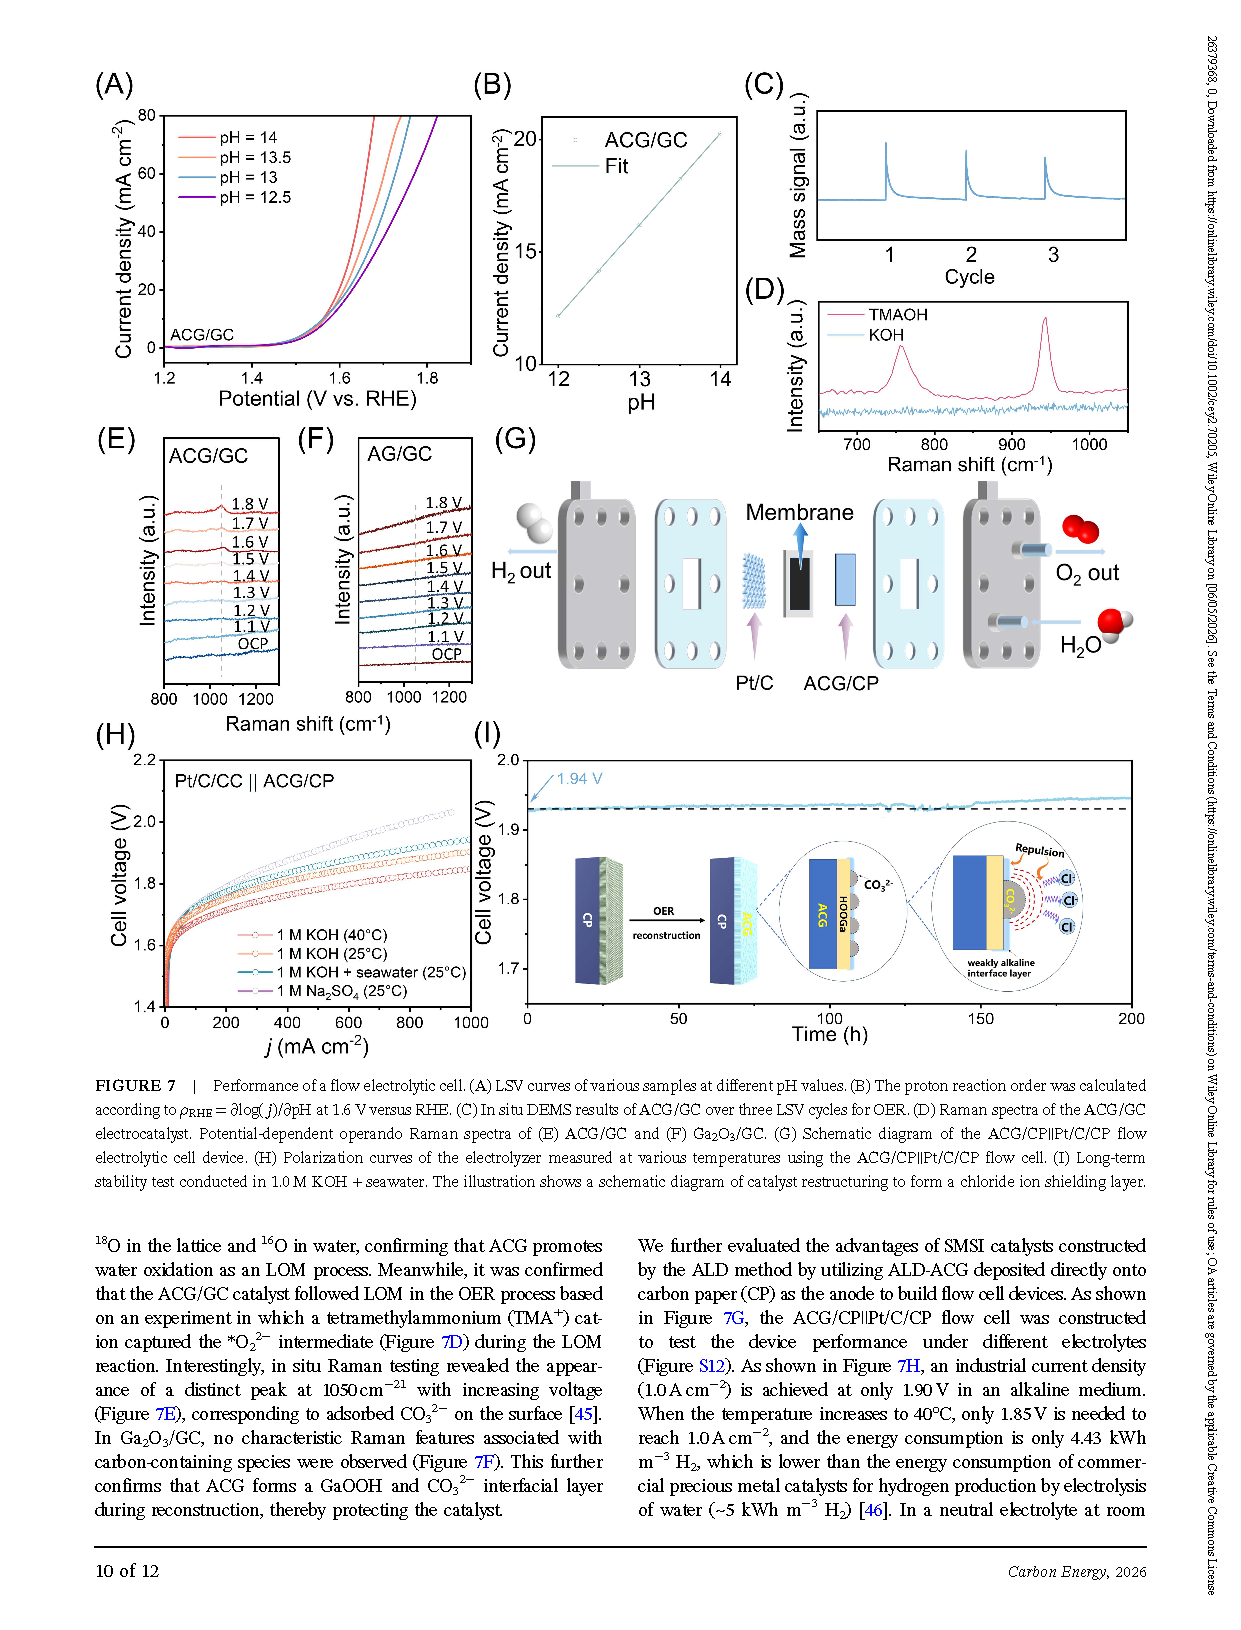
Figure 7 Performance of a flow electrolytic cell. (A) LSV curves of various samples at different pH values. (B) The proton reaction order was calculated according to ρ_RHE=∂log (j)/∂pH at 1.6 V versus RHE. (C) In situ DEMS results of ACG/GC over three LSV cycles for OER. (D) Raman spectra of the ACG/GC electrocatalyst. Potential-dependent operando Raman spectra of (E) ACG/GC and (F) Ga₂O₃/GC. (G) Schematic diagram of the ACG/CP‖Pt/C/CP flow electrolytic cell device. (H) Polarization curves of the electrolyzer measured at various temperatures using the ACG/CP‖Pt/C/CP flow cell. (I) Long-term stability test conducted in 1.0 M KOH + seawater. The illustration shows a schematic diagram of catalyst restructuring to form a chloride ion shielding layer.
DOI:
doi.org/10.1002/cey2.70205