

Paper Sharing
【International Papers】Red photoluminescence from Mn-doped β-Ga₂O₃: Optical signature of an Mn³⁺ ion?
日期:2025-11-20阅读:430
Researchers from the Linköping University have published a dissertation titled " Red photoluminescence from Mn-doped β-Ga2O3: Optical signature of an Mn3+ ion?" in Applied Physics Letters.
Background
β-Ga2O3 is an ultra-wide bandgap semiconductor (Eg ∼ 4.8 eV), promising for applications in power electronics and deep-UV optoelectronics. Transition-metal (TM) ions represent an important class of impurities in β-Ga2O3 as they can be easily incorporated in this material as intentional dopants or residual impurities, affecting light absorption and emission, as well as electrical conductivity. For example, β-Ga2O3 containing Cr3+ ions could be used as a light emitter/phosphor owing to an intense red luminescence analogous to that in ruby: two narrow R-lines at 689 and 696 nm (1.80–1.78 eV) corresponding to the 2E → 4A2 spin-forbidden transitions of Cr3+ with a 3d3 electronic configuration, superimposed on a broad emission band peaking at ∼715 nm from the spin-allowed 4T2 → 4A2 transition. On the other hand, Fe doping is a common approach to produce semi-insulating material, as Fe introduces a (0/-) acceptor level, which compensates unintentional n-type dopants intrinsic to this material.
Abstract
A sharp photoluminescence (PL) line at ∼710 nm, commonly present in Mn-doped β-Ga2O3, has previously been attributed to an intra-center transition of an Mn4+ ion with the d3 electronic configuration, based on similarities of its properties with the well-known 2E → 4A2 transitions of Cr3+. In this study, we present spectroscopic data that challenge this interpretation and suggest that the 710-nm emission likely originates from Mn3+ in a high-spin d4 configuration. Specifically, temperature-dependent magneto-PL data indicate that the emission originates from internal transitions between a non-degenerate S = 0 excited state and the S = 2 ground state of the involved center, incompatible with the S = 3/2 spin of Mn4+. Time-resolved PL measurements reveal a long emission lifetime (∼800 μs), characteristic of spin-forbidden internal d–d transitions. These observations, along with the determined spin-Hamiltonian parameters of the center, are consistent with a transition from a low-lying spin-singlet excited state to a high-spin 5E ground state of Mn3+, orbitally split by a local crystal field. A second emission line at ∼694 nm, which is much weaker and spatially inhomogeneous, exhibits nearly identical magnetic and thermal behavior, suggesting that it arises from the Mn3+ ion perturbed by a nearby defect. Our findings, therefore, provide a spectroscopic signature of the previously undocumented Mn3+ ion in β-Ga2O3.
Conclusion
In summary, we have shown that Mn doping of β-Ga2O3 leads to the appearance of two sharp emission lines at ∼710 and ∼694 nm. Using magneto-optical PL spectroscopy complemented by time-resolved PL measurements, we have determined the electronic structure of the center responsible for the dominant 710-nm emission and showed that it stems from spin-forbidden internal transitions between the S = 0 excited state and S = 2 ground state of a TM ion, likely with a 3d4 electronic configuration. A possible candidate is the Mn3+ ion residing on the distorted octahedral Ga(II) site with a sixfold coordination. A substantial zero-field splitting of the ground state of ∼0.15 meV is observed, reflecting a low-symmetry crystal field effect. The revealed spin properties of the center, coupled with a relatively high Debye–Waller factor of 0.12, make the Mn3+ ion a suitable candidate for potential use as a spin-photon emitter. The weaker 694-nm line is tentatively attributed to a center of the same origin but locally perturbed due to the presence of a nearby defect or its proximity to surfaces. Our findings, therefore, fill a gap in the understanding of transition-metal dopants in β-Ga2O3, providing a spectroscopic signature of Mn3+ ion in this material that was lacking so far. The gained knowledge could also be useful for current research efforts in utilizing TM color centers and spin centers for applications in optoelectronics, optospintronics, and quantum information technology.
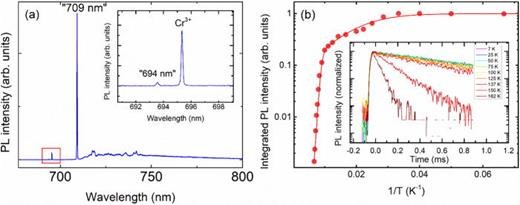
FIG. 1. (a) A representative PL spectrum measured at 7 K from Mn-doped β-Ga2O3 crystals. The inset shows a close-up of the PL emission within the 690–700 nm spectral range. (b) An Arrhenius plot of the integrated intensity of the 710 nm line. The insert shows time decay profiles of the 710 nm emission at measurement temperatures as indicated in the figure.
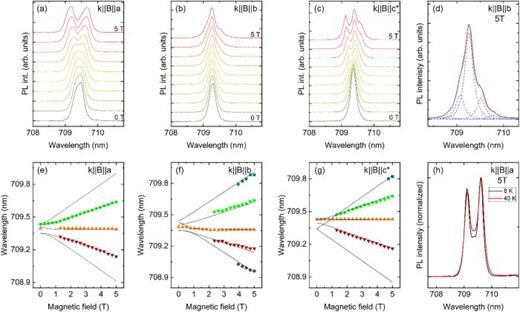
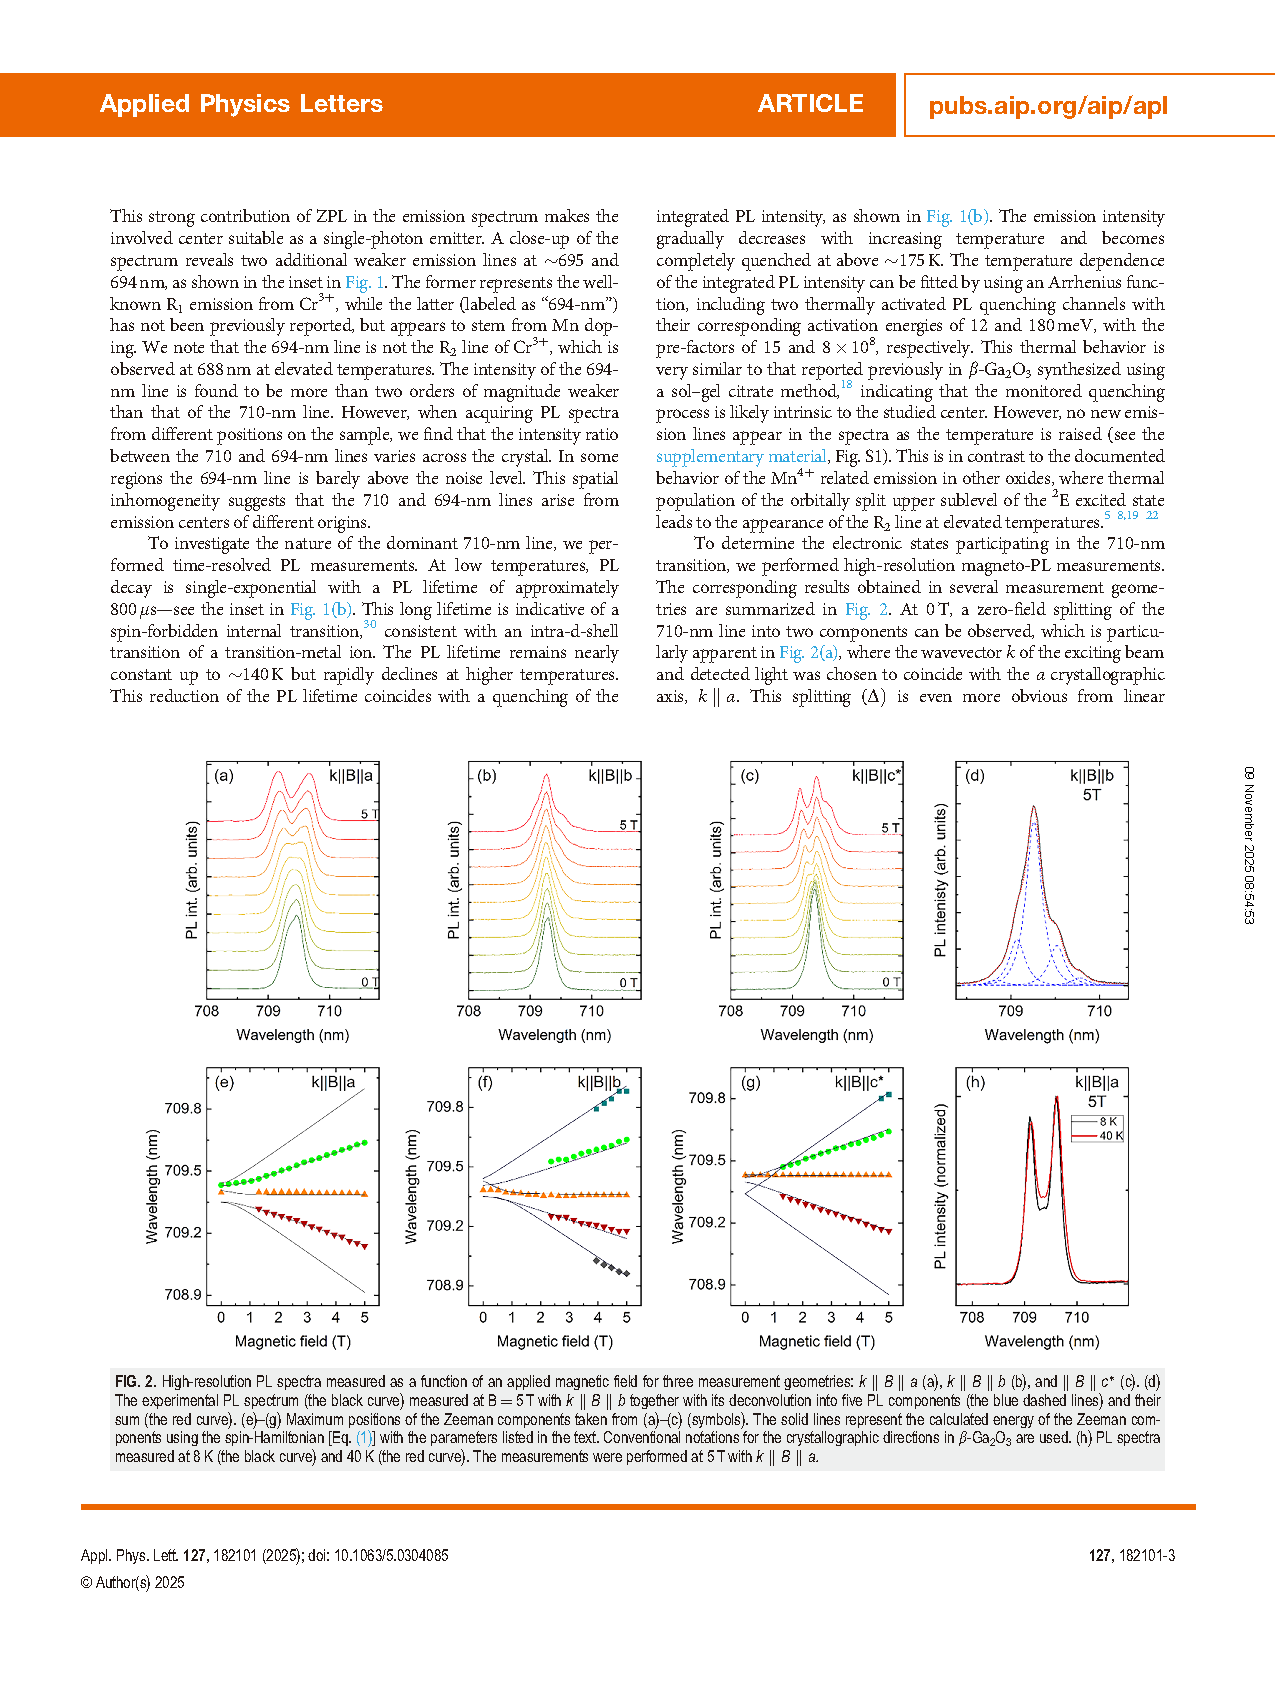
FIG. 2. High-resolution PL spectra measured as a function of an applied magnetic field for three measurement geometries: k || B || a (a), k || B || b (b), and || B || c* (c). (d) The experimental PL spectrum (the black curve) measured at B = 5 T with k || B || b together with its deconvolution into five PL components (the blue dashed lines) and their sum (the red curve). (e)–(g) Maximum positions of the Zeeman components taken from (a)–(c) (symbols). The solid lines represent the calculated energy of the Zeeman components using the spin-Hamiltonian [Eq. (1)] with the parameters listed in the text. Conventional notations for the crystallographic directions in β-Ga2O3 are used. (h) PL spectra measured at 8 K (the black curve) and 40 K (the red curve). The measurements were performed at 5 T with k || B || a.
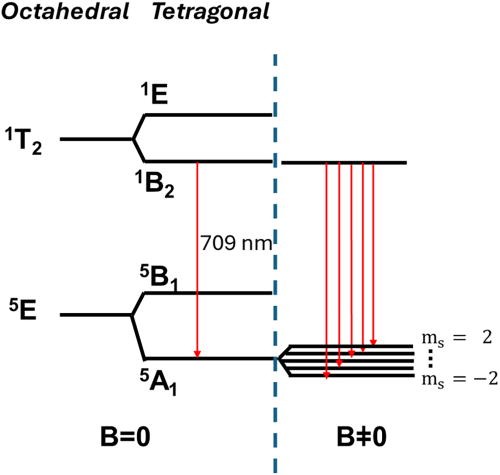
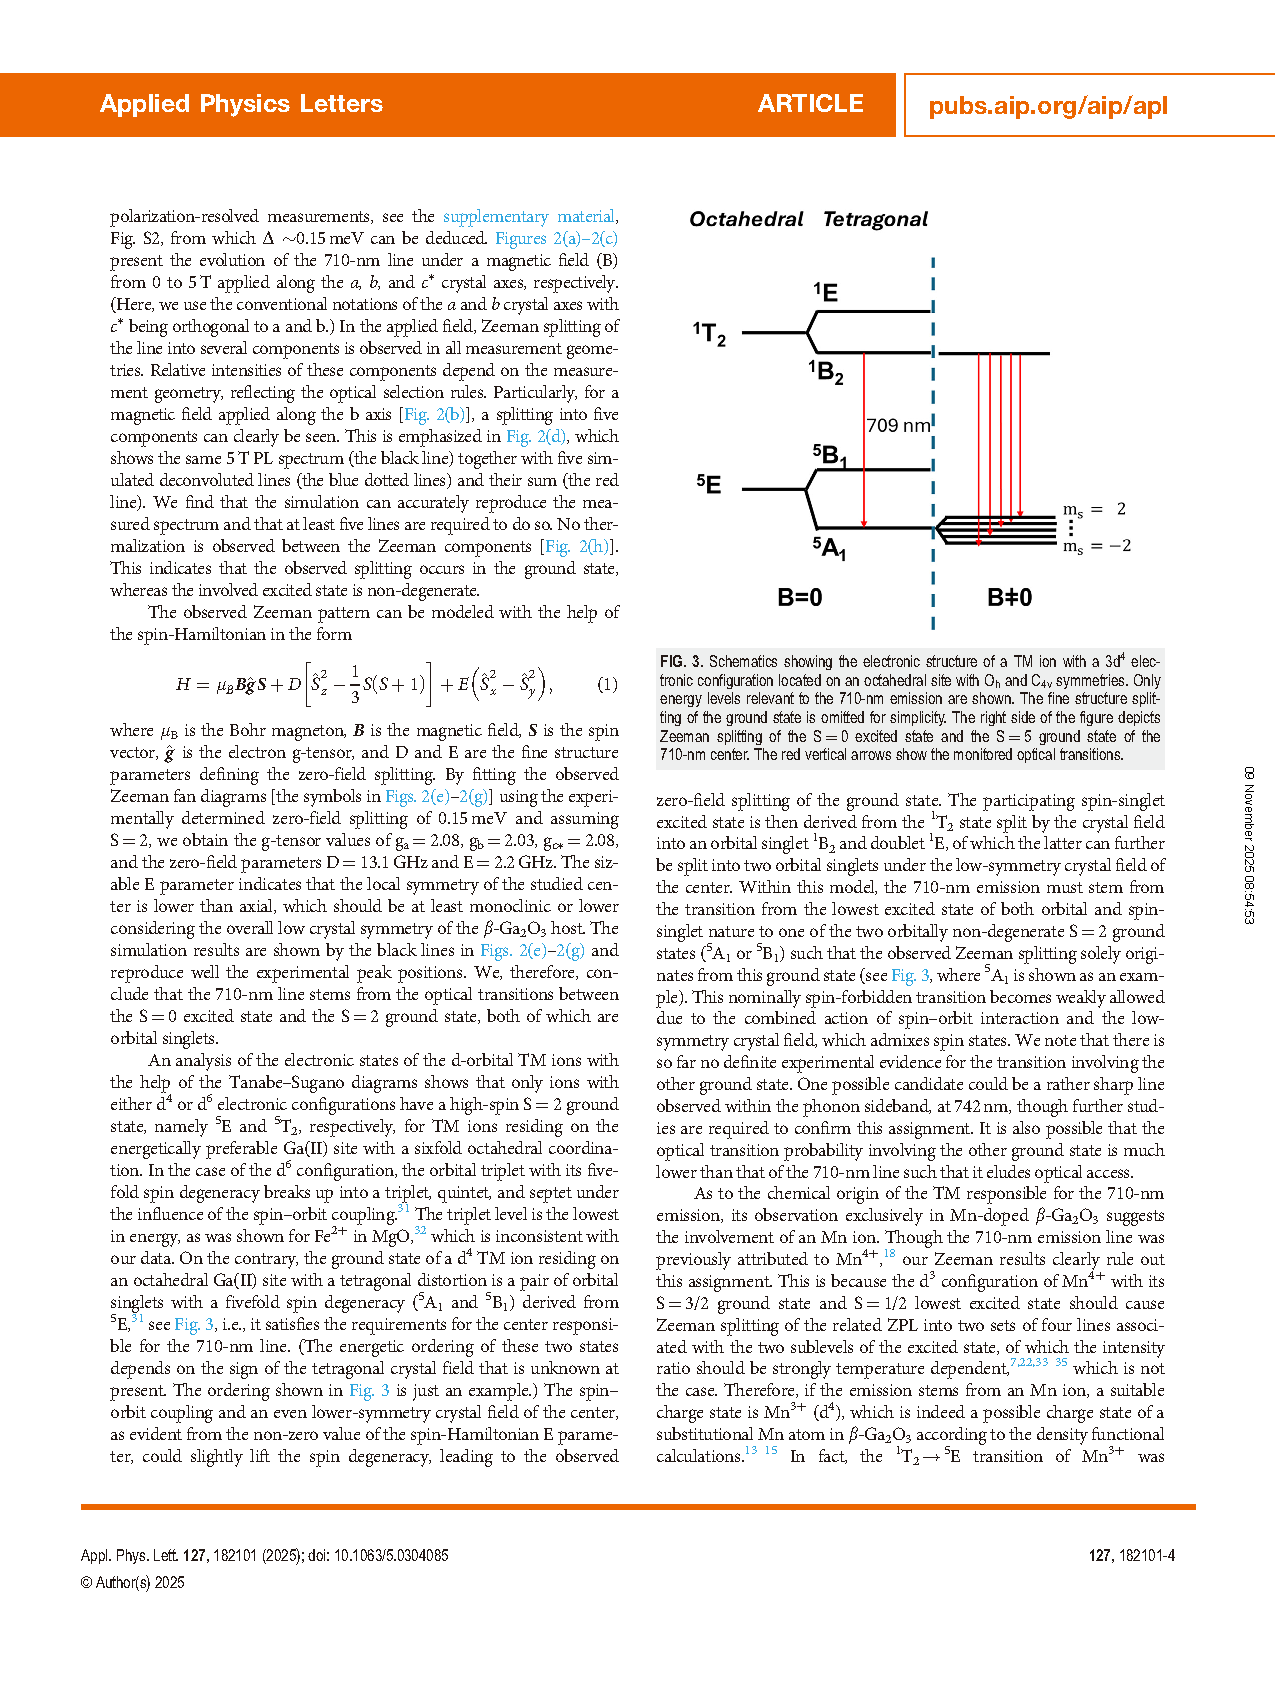
FIG. 3. Schematics showing the electronic structure of a TM ion with a 3d4 electronic configuration located on an octahedral site with Oh and C4v symmetries. Only energy levels relevant to the 710-nm emission are shown. The fine structure splitting of the ground state is omitted for simplicity. The right side of the figure depicts Zeeman splitting of the S = 0 excited state and the S = 5 ground state of the 710-nm center. The red vertical arrows show the monitored optical transitions.
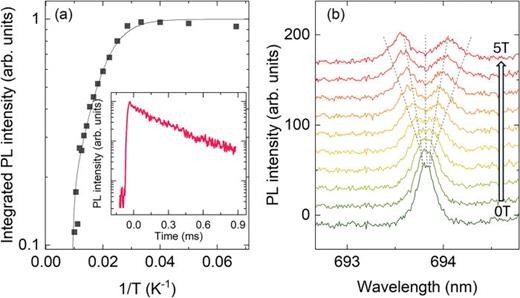
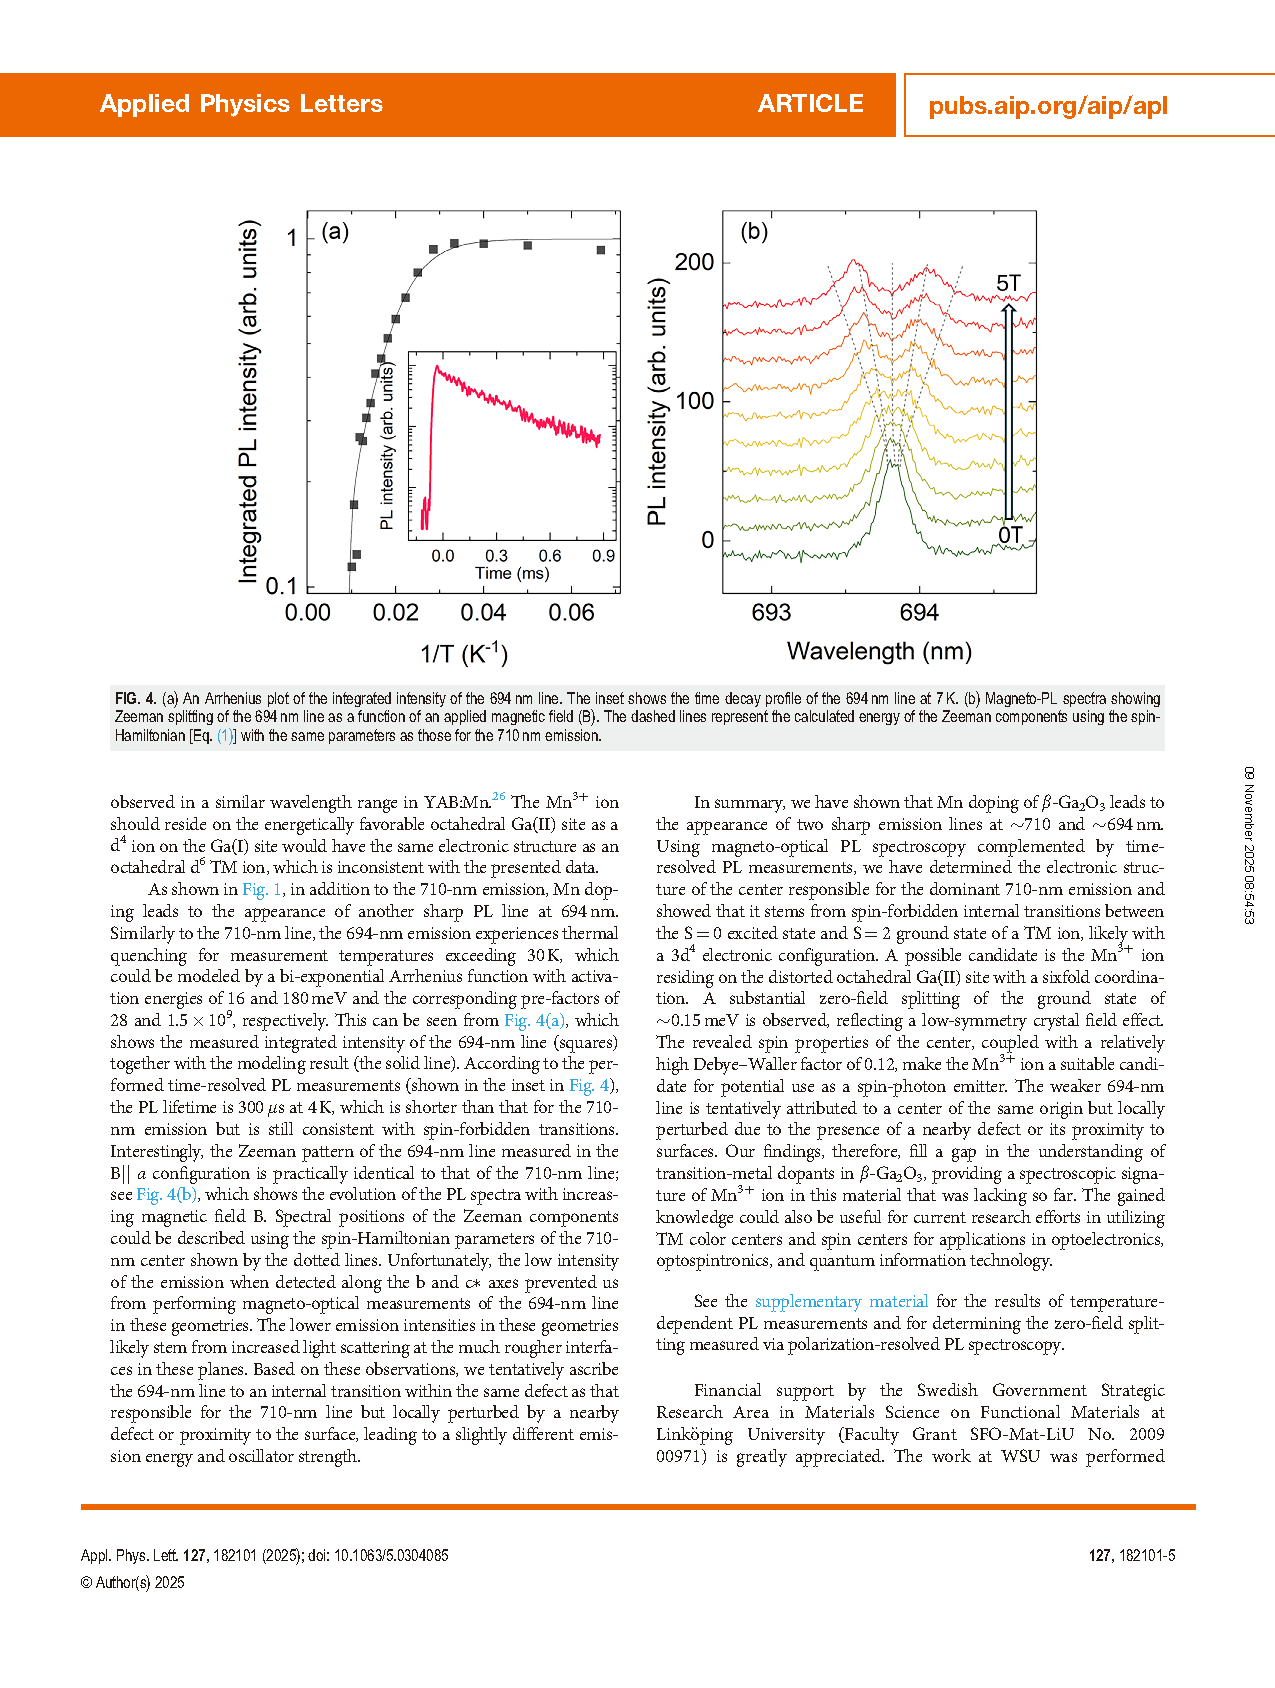
FIG. 4. (a) An Arrhenius plot of the integrated intensity of the 694 nm line. The inset shows the time decay profile of the 694 nm line at 7 K. (b) Magneto-PL spectra showing Zeeman splitting of the 694 nm line as a function of an applied magnetic field (B). The dashed lines represent the calculated energy of the Zeeman components using the spin-Hamiltonian with the same parameters as those for the 710 nm emission.
DOI:
doi.org/10.1063/5.0304085