

Paper Sharing
【International Papers】Supersaturation-Dependent Competition between β and κ Phases in the MOVPE Growth of Ga₂O₃ on Al₂O₃ (0001) and GaN (0001) Substrates
日期:2025-11-17阅读:496
Researchers from the University of Parma have published a dissertation titled "Supersaturation-Dependent Competition between β and κ Phases in the MOVPE Growth of Ga2O3 on Al2O3 (0001) and GaN (0001) Substrates" in ACS Applied Materials & Interfaces.
Background
Gallium oxide (Ga₂O₃) is an ultrawide-bandgap semiconductor with multiple polymorphs, among which the β- and κ-phases are of particular interest. The β-phase is thermodynamically stable and widely used in power electronics, while the κ-phase is metastable but exhibits spontaneous polarization and higher crystal symmetry, offering potential for polarization-engineered devices such as HEMTs. However, controlling the phase formation of Ga₂O₃ during MOVPE growth remains challenging because the competition between β and κ phases strongly depends on growth conditions such as supersaturation and substrate-induced strain.
Abstract
We present an analysis of the phase stabilization of β-Ga2O3 and κ-Ga2O3 grown by metal–organic vapor-phase epitaxy with varying supersaturation of the gas-phase precursors on c-sapphire and GaN substrates. We compare in-depth structural analyses of the bulk and interface layers, also through the measurement of strain relaxation across the structure, with a comprehensive nucleation model, based on multiscale simulations. A coherent and quantitative interpretation of different stages of the nucleation of Ga2O3 phases on sapphire is elaborated on, highlighting the crucial role of the supersaturation of gas precursors and of the residual misfit strain within the initial layers in the stabilization of competing Ga2O3 polymorphs.
Conclusion
In this paper, we have investigated in detail the morphology and texture of the early stages of the MOVPE growth of Ga₂O₃ on (0001) Al₂O₃ and GaN substrates, and compared these results with the predictions of a theoretical nucleation model based on first-principles parameters. Our study shows that the observed competition between β and κ phases is driven by both thermodynamics — i.e., different nucleation rates — and surface kinetics — i.e., different growth speeds on any given surface. Both phenomena depend critically on the supersaturation.
We unveil the MOVPE growth mechanism, which we describe through a sequence of different growth steps. A first nucleation layer, composed of coalesced 3D-β islands, is always present because of the high lattice misfit between Ga₂O₃ and the α-Al₂O₃ or GaN substrate.
During the subsequent growth of Ga₂O₃, the nucleation layer partly acts as a template, the properties of which are strongly influenced by the type of underlying substrate. The further development of the κ or β phase is then mainly driven by two mechanisms: the different residual strain in the β nucleation layer and the different interface energy between the nucleation layer itself and the κ phase.
In addition, our theoretical modeling suggests that the lateral step energy of 2D-κ islands might be smaller than that for 2D-β islands, an issue that may require further experimental investigations.
The results presented in this paper provide insightful information on the role of the interlayer and on the effect of strain in the stabilization of different phases of Ga₂O₃. This should allow for advanced engineering of the interface between the substrate and epitaxial layer to improve its crystalline quality and increase the performance of devices based on this wide-bandgap material.
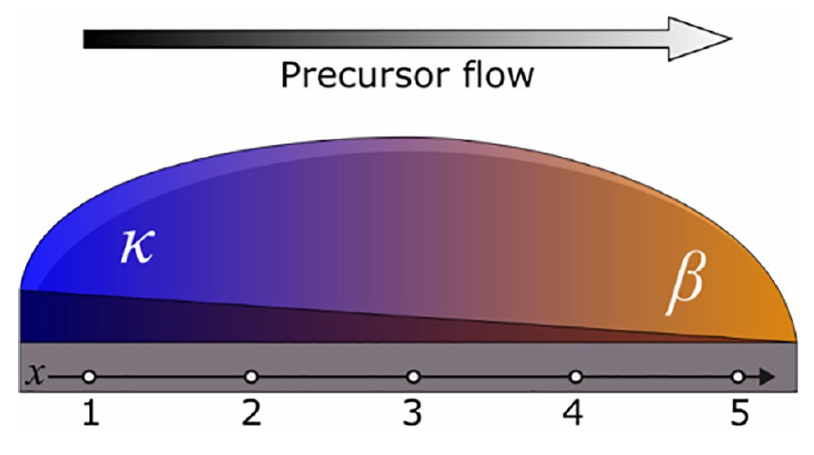
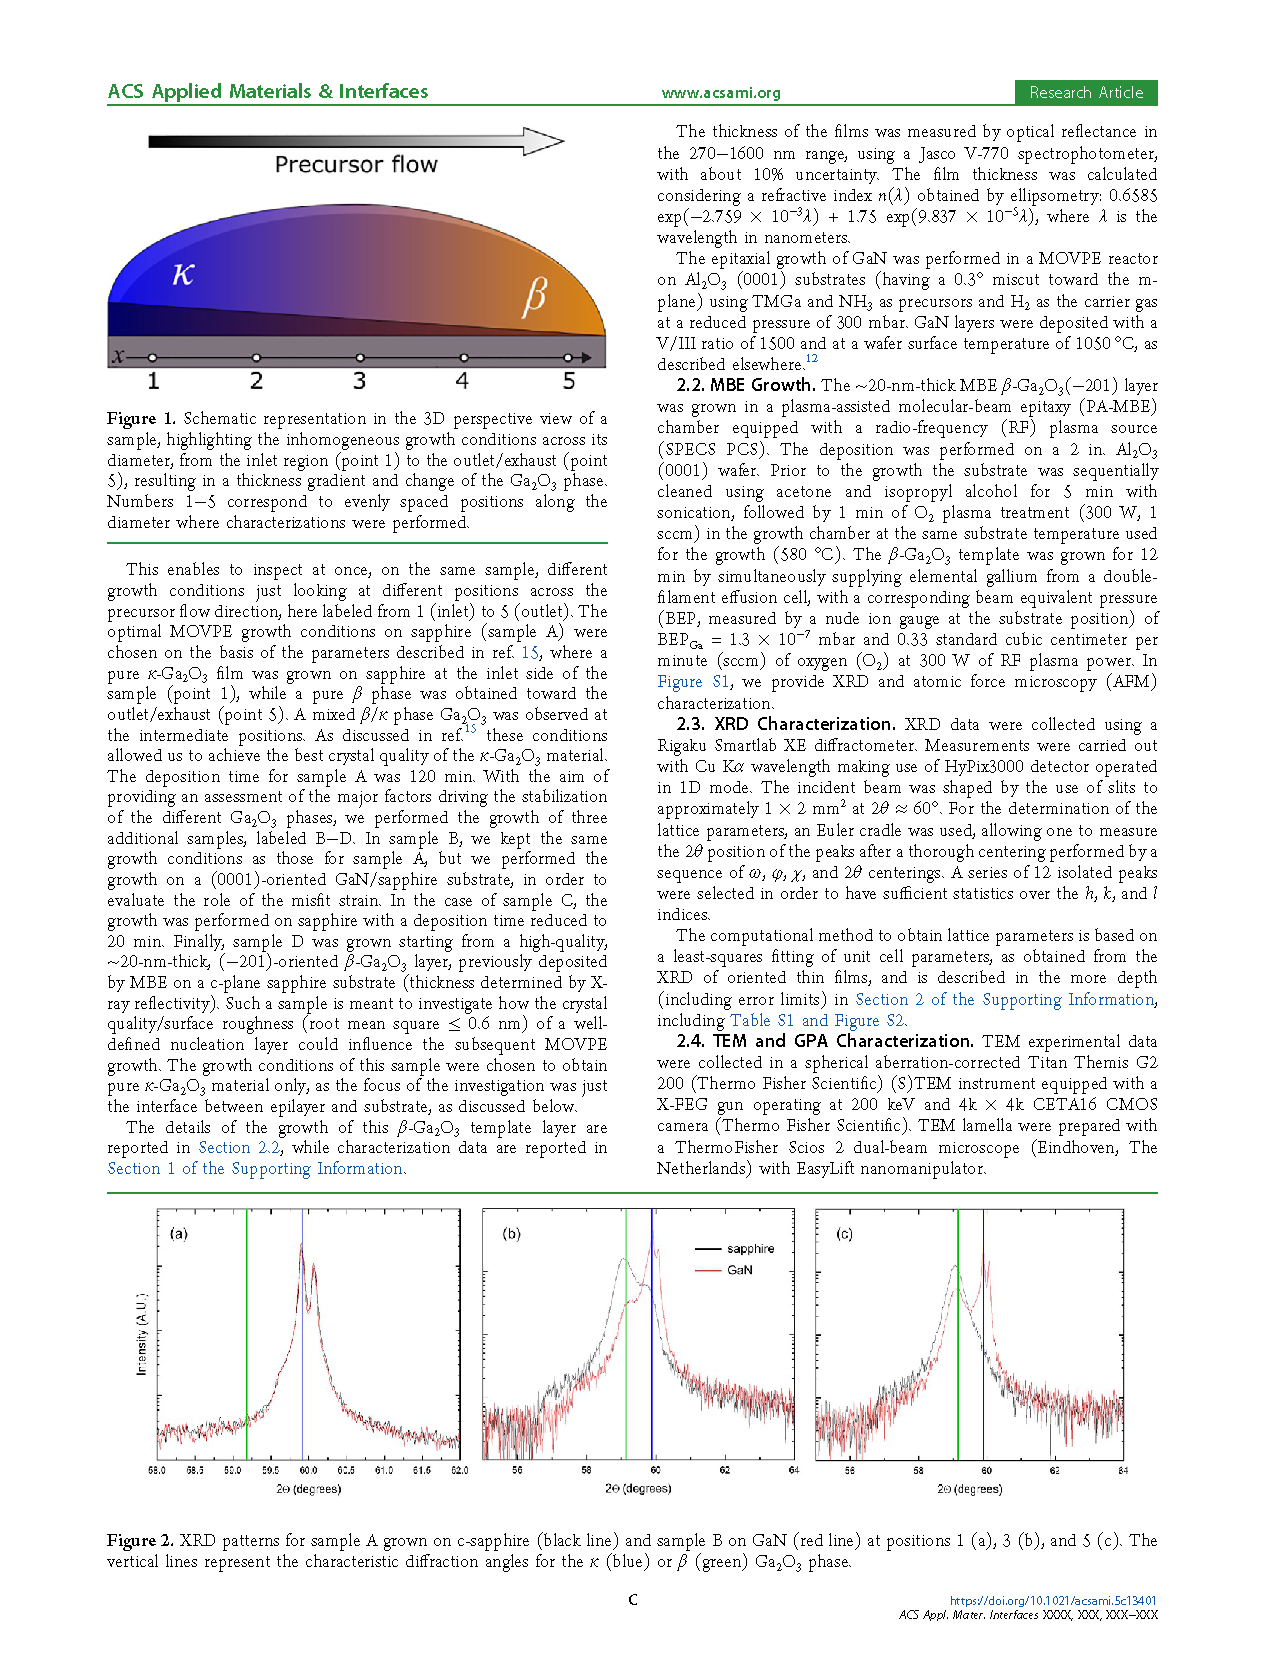
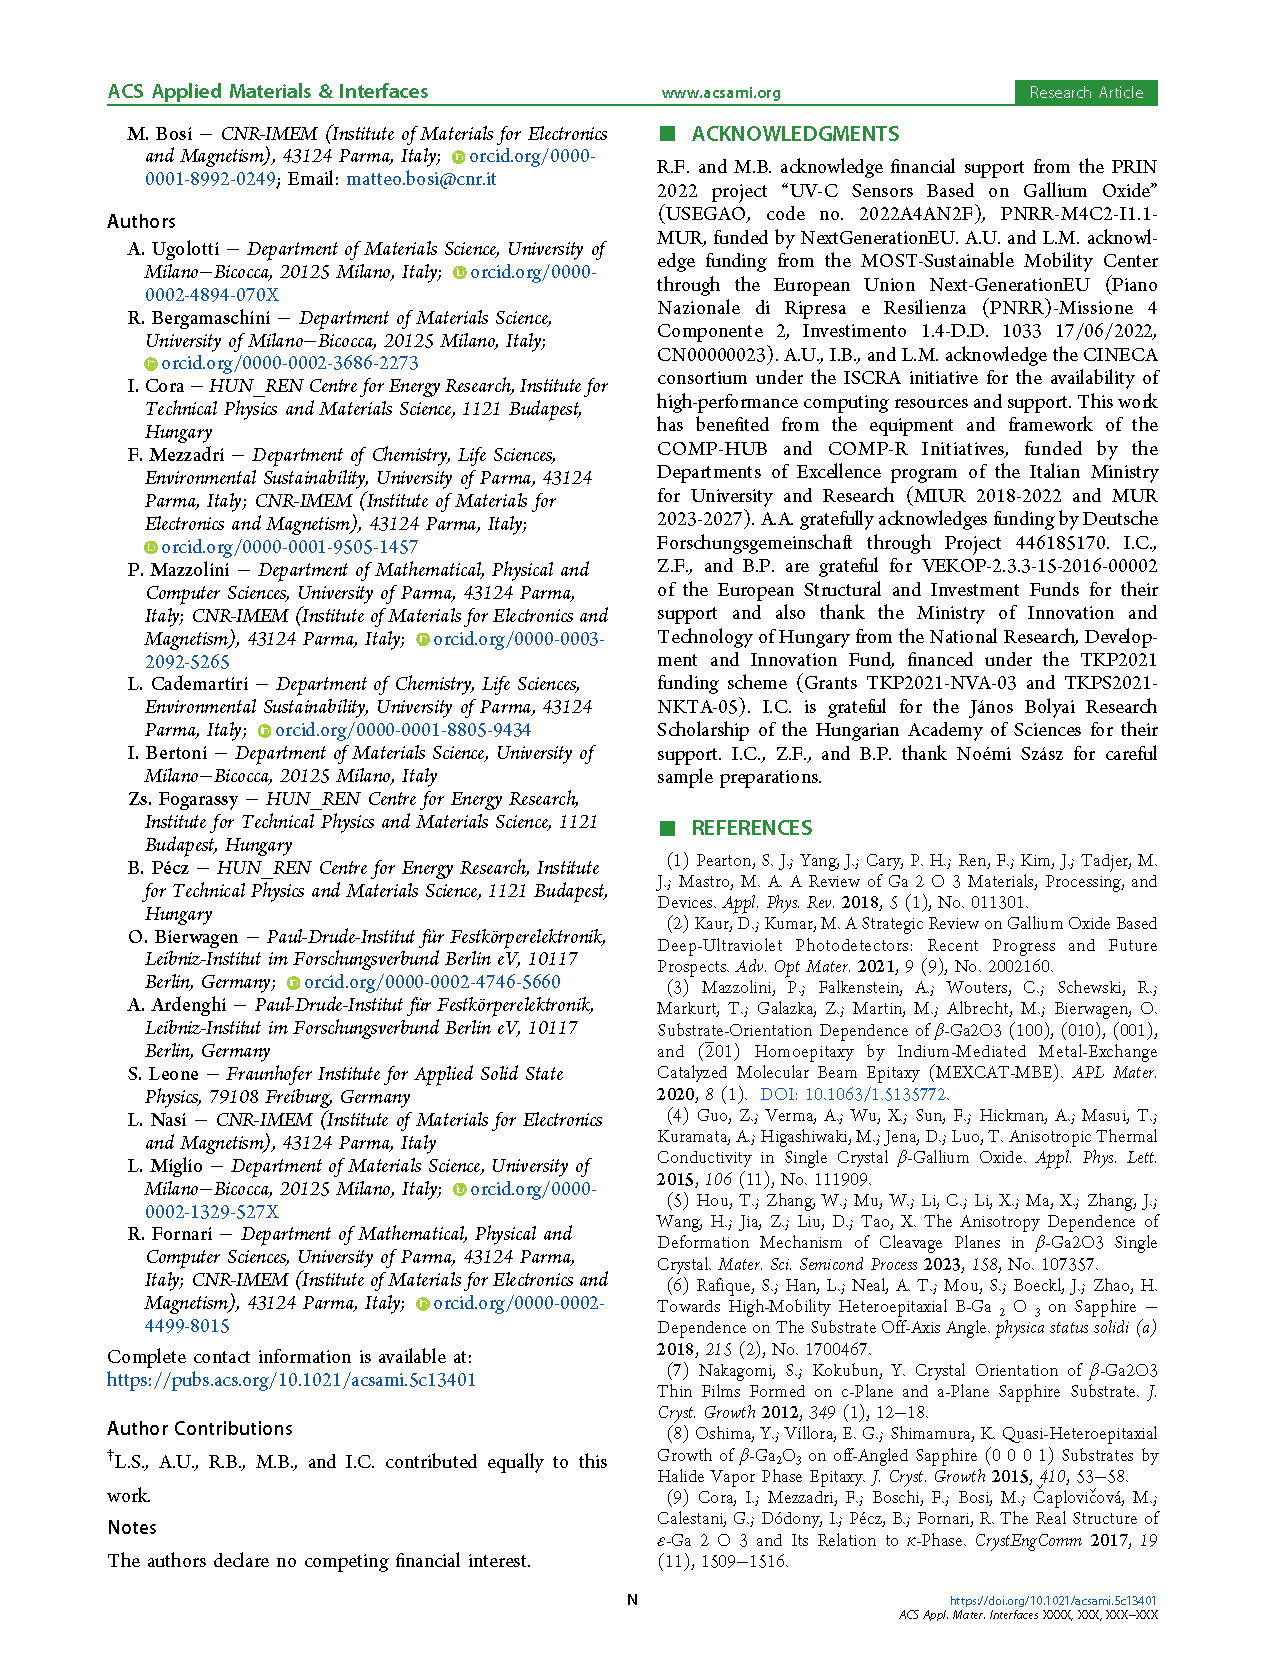
Figure 1. Schematic 3D perspective view of a sample, highlighting the inhomogeneous growth conditions across its diameter—from the inlet region (point 1) to the outlet/exhaust (point 5)—resulting in a thickness gradient and a change of the Ga₂O₃ phase. Numbers 1–5 correspond to evenly spaced positions along the diameter where characterizations were performed.
Figure 2. XRD patterns for sample A grown on c-sapphire (black line) and sample B on GaN (red line) at positions 1 (a), 3 (b), and 5 (c). The vertical lines indicate the characteristic diffraction angles for the κ (blue) or β (green) Ga₂O₃ phases.
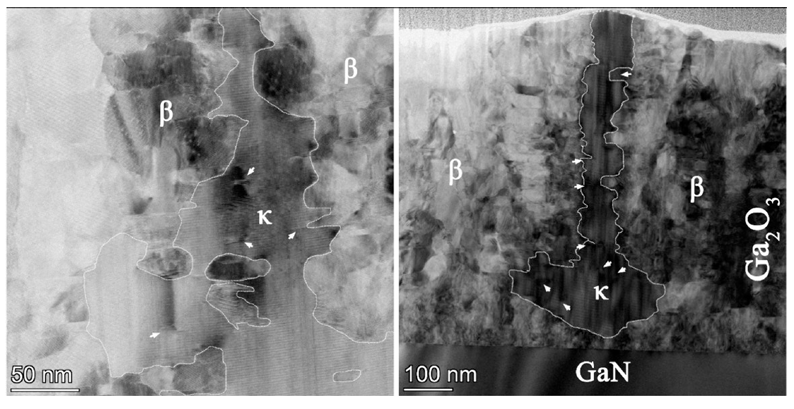
Figure 3. Bright-field TEM images with phase contrast of sample A on sapphire (left) and sample B on GaN (right). The grain boundaries between different phases are highlighted, and white arrows indicate areas where β-Ga₂O₃ begins to nucleate parallel to the growth of κ-Ga₂O₃.
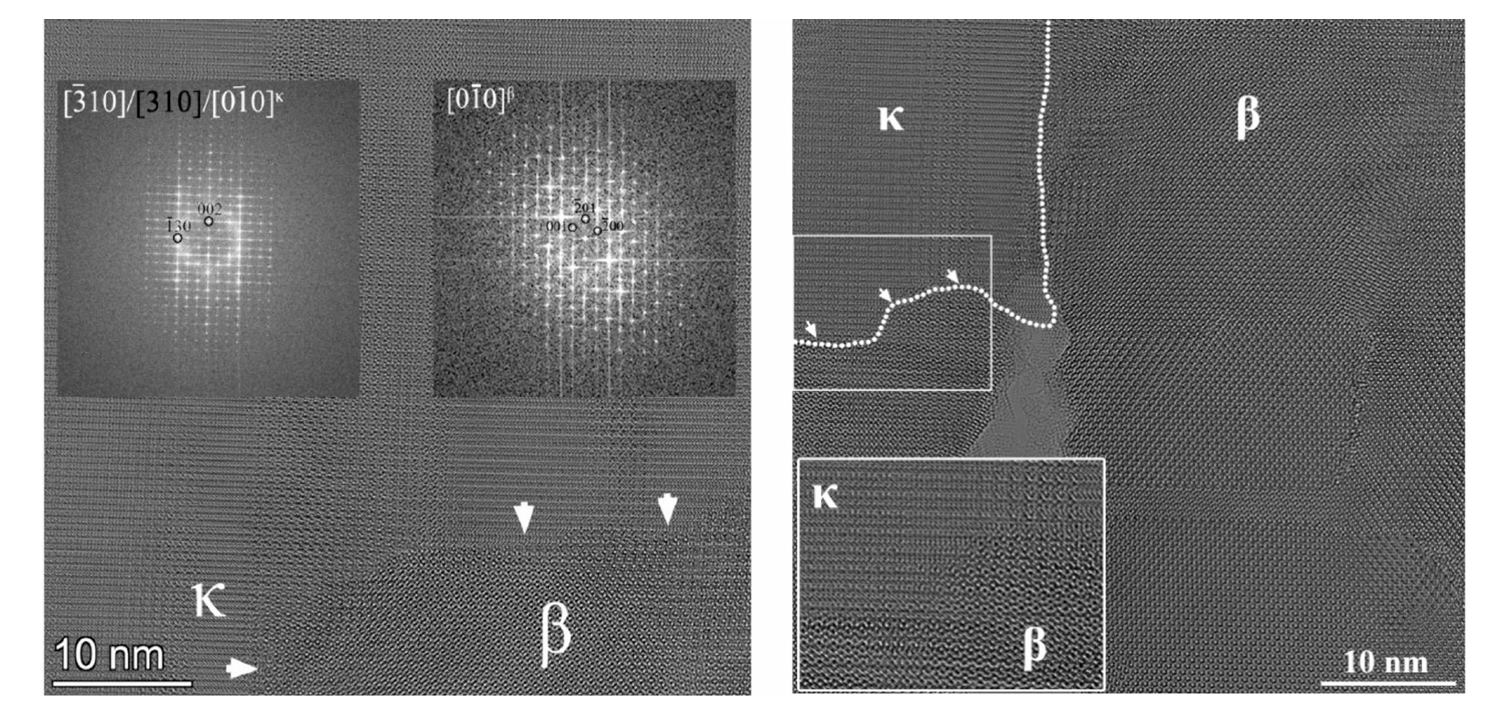
Figure 4. HRTEM images of sample B on GaN, showing the boundary between the κ and β areas with arrows and enlarged insets. Indexed FFTs display the orientation relationship between the two crystals (κ and β).
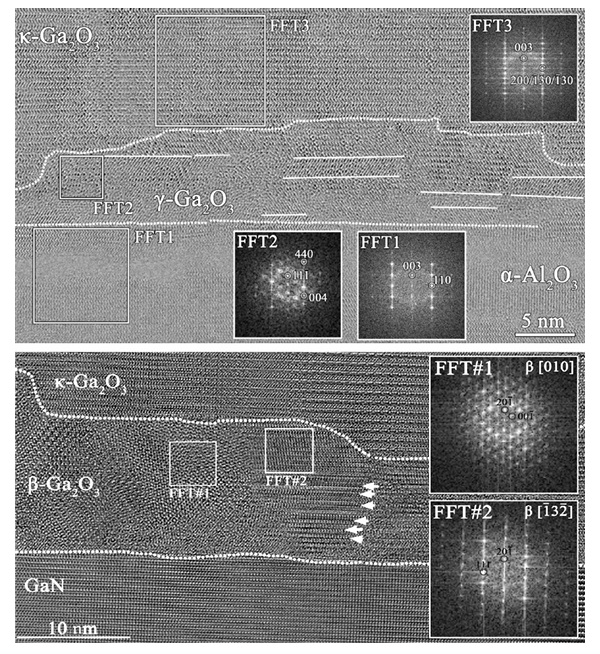
Figure 5. HRTEM images of the interface for samples A (top) and B (bottom), with indexed FFTs showing the orientation of the identified phases. White arrows indicate extended defects.
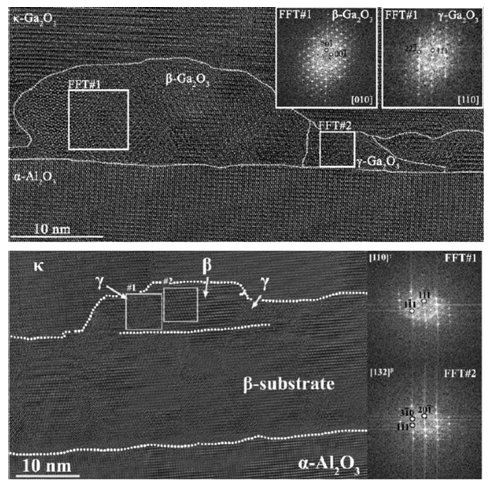
Figure 6. HRTEM images of the interface for sample C on sapphire (top) and sample D on β-Ga₂O₃ template (bottom), with indexed FFTs showing the orientation of the identified phases.
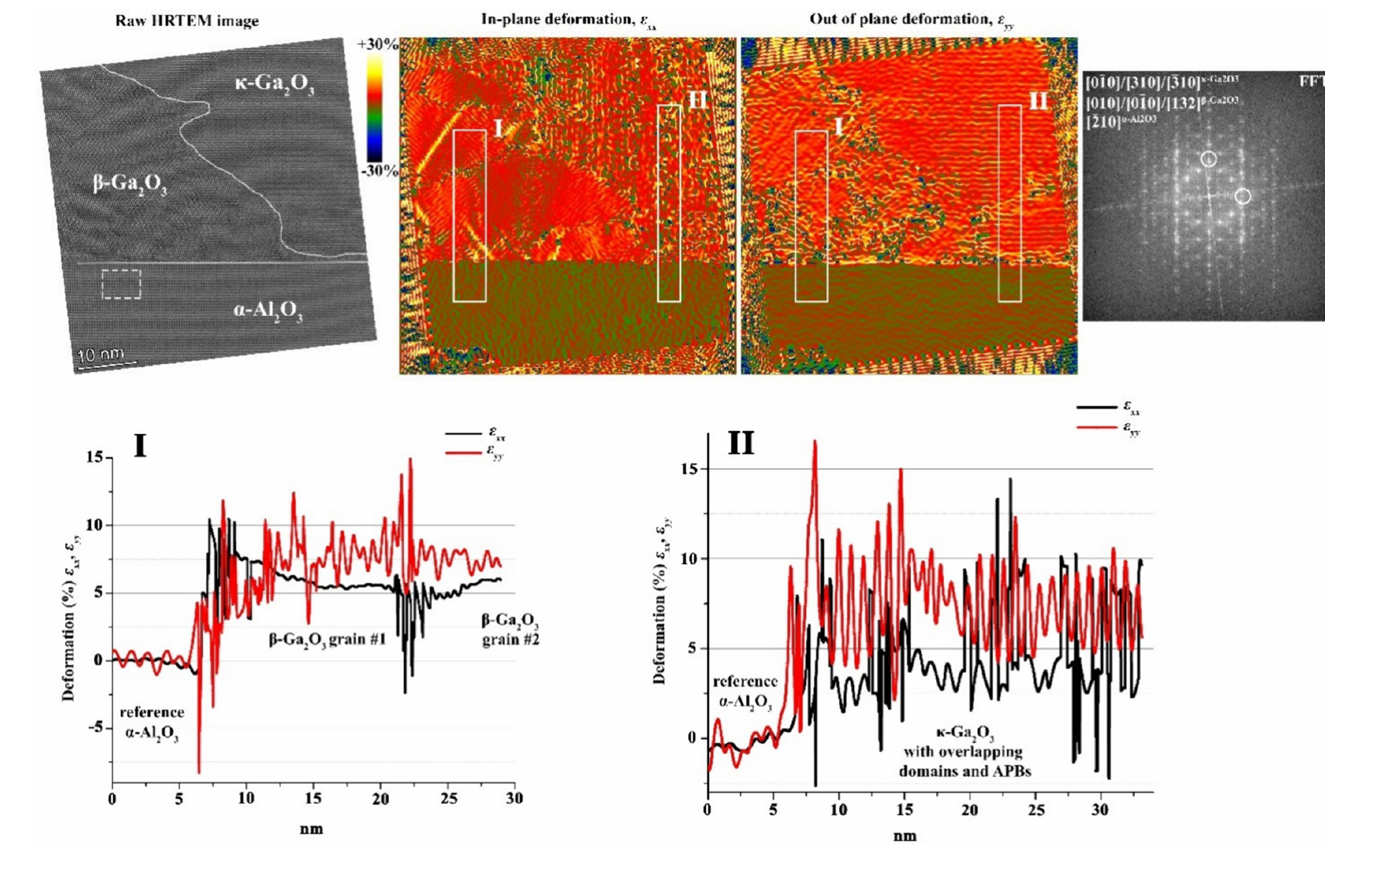
Figure 7. HRTEM image and deformation/strain maps calculated by GPA from sample A at position 3. The integrated deformation/strain profiles shown in the lower panels are taken from two different areas, highlighted as boxes I and II: one passing through two large and thick domains of the β-interlayer (left) and one with a very thin β-interlayer below the κ phase (right). Errors are within the ±0.02 range. The region taken as a reference for GPA is highlighted by the dashed rectangle on the HRTEM image. In its FFT plot, shown in the top-right panel, the two sets of diffraction spots selected for the analysis are marked by white circles.

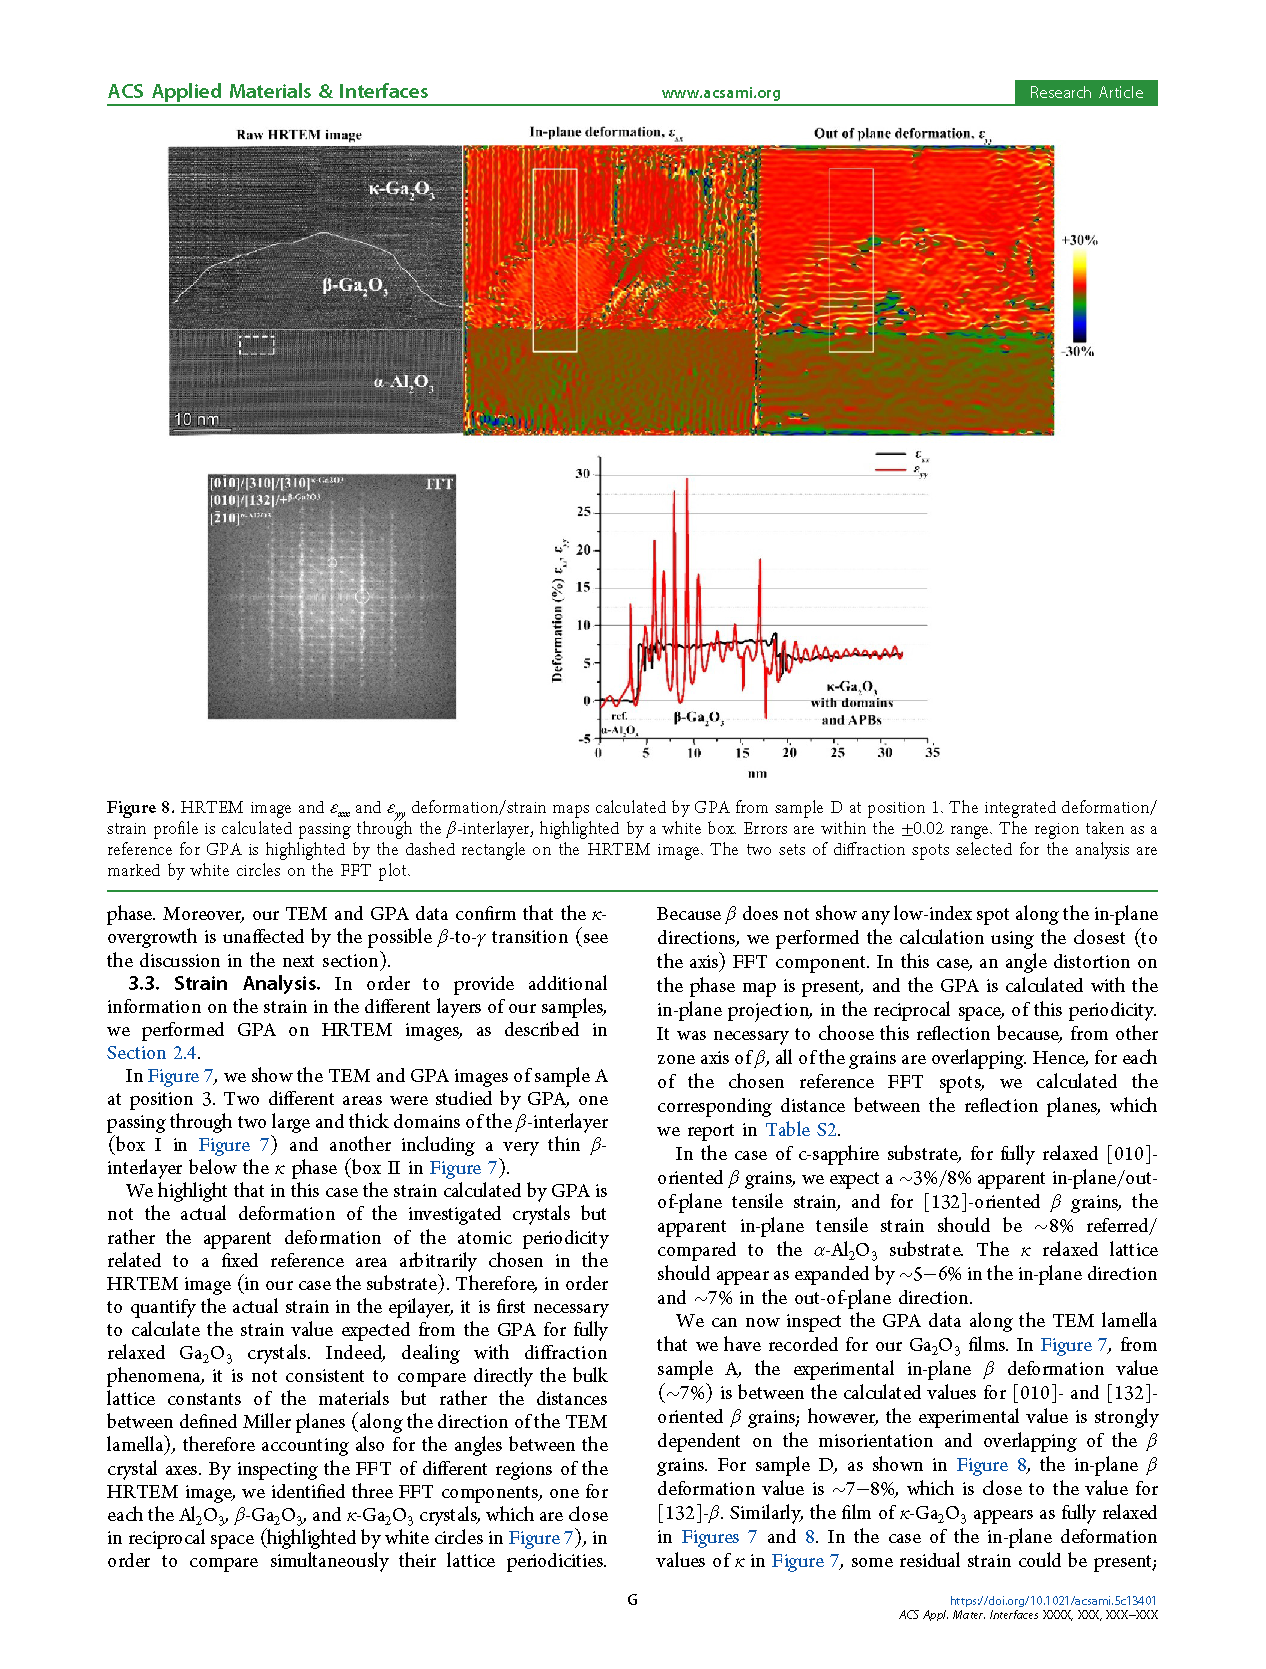
Figure 8. HRTEM image and εxx and εyy deformation/strain maps calculated by GPA from sample D at position 1. The integrated deformation/strain profile is calculated passing through the β-interlayer, highlighted by a white box. Errors are within the ±0.02 range. The region taken as a reference for GPA is highlighted by the dashed rectangle on the HRTEM image. The two sets of diffraction spots selected for analysis are marked by white circles on the FFT plot.

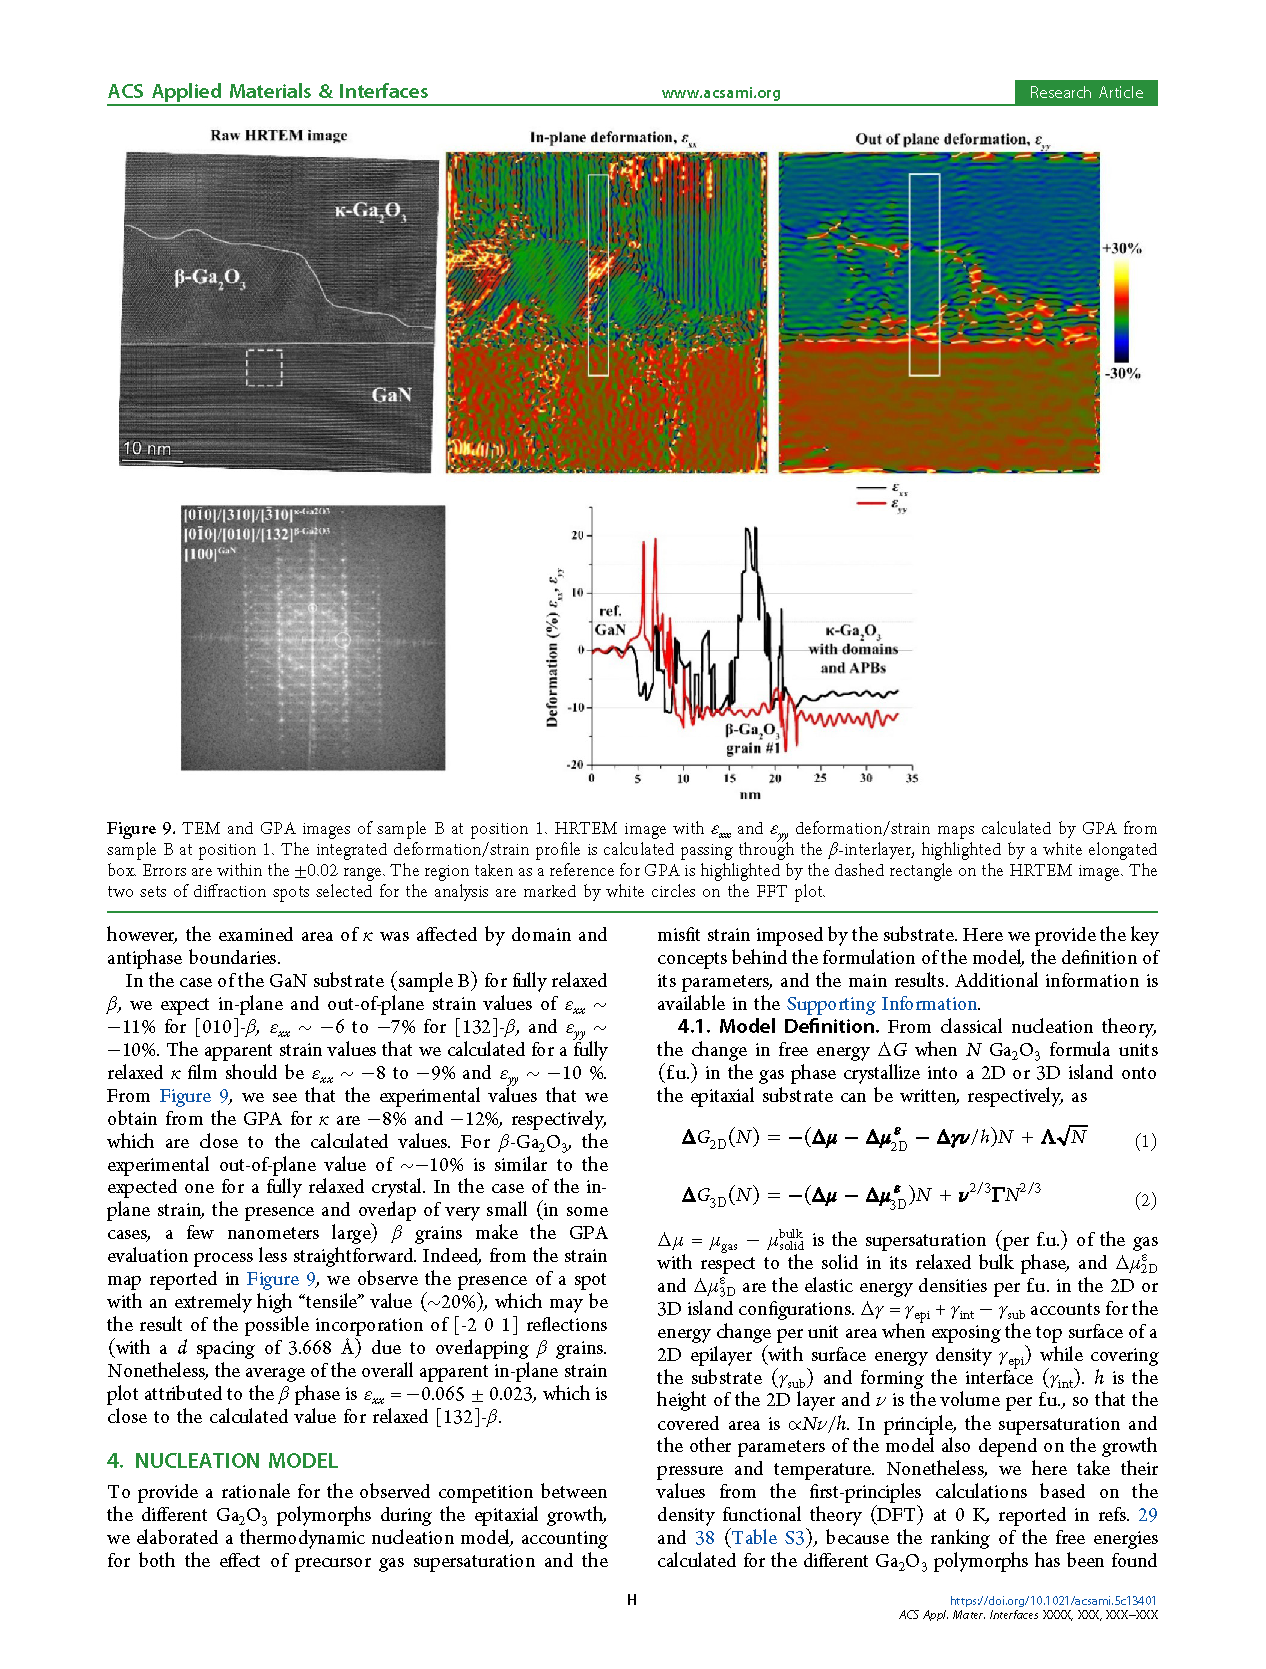
Figure 9. TEM and GPA images of sample B at position 1. HRTEM image with εxx and εyy deformation/strain maps calculated by GPA. The integrated deformation/strain profile is calculated passing through the β-interlayer, highlighted by a white elongated box. Errors are within the ±0.02 range. The region taken as a reference for GPA is highlighted by the dashed rectangle on the HRTEM image. The two sets of diffraction spots selected for analysis are marked by white circles on the FFT plot.

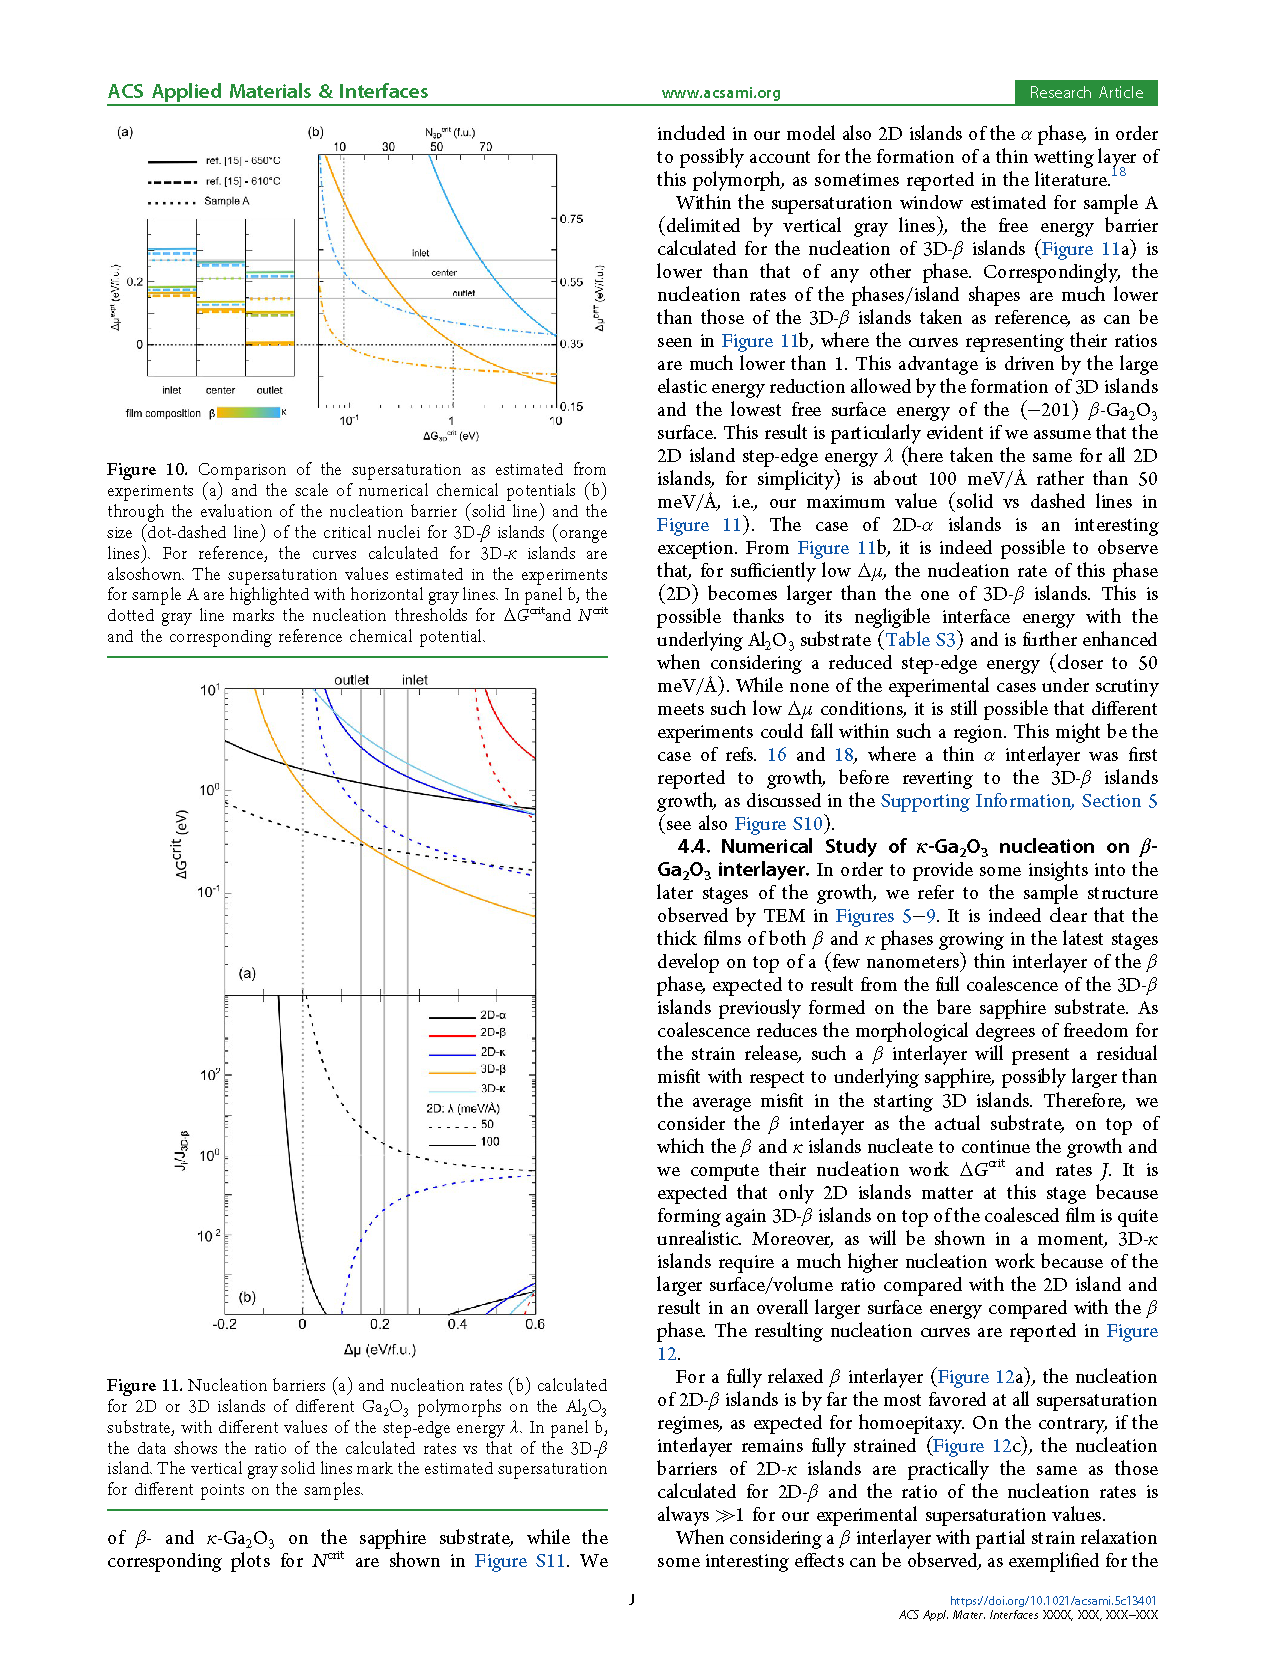
Figure 10. Comparison of the supersaturation as estimated from experiments (a) and the scale of numerical chemical potentials (b) through the evaluation of the nucleation barrier (solid line) and the size (dot-dashed line) of the critical nuclei for 3D-β islands (orange lines). For reference, the curves calculated for 3D-κ islands are also shown. The supersaturation values estimated in the experiments for sample A are highlighted with horizontal gray lines. In panel (b), the dotted gray line marks the nucleation thresholds for ΔGcrit and Ncrit, and the corresponding reference chemical potential.
DOI:
doi.org/10.1021/acsami.5c13401