

Paper Sharing
【Domestic Papers】Amorphous Ga₂O₃ deep UV imager for label-free biomolecule detection
日期:2026-06-08阅读:28
Researchers from Dongguan Institute of Materials Science and Technology have published a dissertation titled " Amorphous Ga₂O₃ deep UV imager for label-free biomolecule detection " in AAPPS Bulletin.
Background
Precise quantification of molecules in biological systems is essential for clinical diagnostics, yet achieving this rapidly and economically remains a significant challenge. Current methods are inherently limited by complex labeling procedures, high costs and low throughput. Thus, advanced label-free sensing platforms capable of direct and efficient in-situ analysis are urgently desired. A practical solution for this challenge can be found in the deep ultraviolet (UV) spectral band. It is well-established that the basic building blocks of biomolecules, including the purine and pyrimidine bases of nucleic acids and aromatic amino acids in proteins, exhibit strong characteristic absorption and photochemical interactions when exposed to UV light. This spectral band effectively acts as a molecular “fingerprint”, offering a unique technological pathway to visualize and quantify these molecules. By integrating UV light sources with high-sensitivity UV photodetectors (PDs), it is possible to develop compact, miniaturized, and label-free biochemical sensing systems that eliminate the need for external tags.
Abstract
Biomolecule analysis plays a vital role in early disease diagnosis, personalized nutrition, food science, and basic biomedical research. Yet, current technologies face fundamental trade-offs between each pair of the parameters including sensitivity, throughput and cost. In this work, a scalable platform for biomolecule sensing was proposed based on amorphous gallium oxide (a-Ga₂O₃) thin film considering its remarkable deep ultraviolet (UV) response property and unique low-temperature compatibility with large-area electronics. A single-pixel a-Ga₂O₃ photodetector with a peak responsivity of 0.65 A/W at 255 nm was first employed to identify four basic biomolecules including adenine, guanine, L-phenylalanine, and L-tyrosine. The concentration-dependent photocurrent varied in good agreement with their distinct UV absorbance properties verified by a commercial UV-Vis spectrometer. Further, a 64 × 64 deep UV imaging array was constructed by directly depositing the a-Ga₂O₃ film onto a commercial amorphous silicon (a-Si) thin-film transistor (TFT) backplane, successfully achieving a high-throughput imaging of the four biomolecules. These results establish a viable strategy for a portable, miniaturized and cost-effective biomolecule sensing circuit with rapid and label-free detection.
Conclusion
In summary, we have successfully developed a label-free and high-throughput biomolecule detection platform by integrating a-Ga₂O₃ deep UV PD with mature a-Si TFT backplane. The single MSM-structured a-Ga₂O₃ PD displays a peak responsivity of 0.65 A/W at 255 nm, realizing comparable resolution capability with commercial spectrometers under UV 254 nm illumination. More importantly, a 64 × 64 deep UV imaging array was constructed, effectively overcoming the integration bottleneck typically associated with crystalline counterparts. As a proof of concept, we have developed an integrated system including the imaging array, a ROIC module and a mobile terminal for real-time display, demonstrating the capability for rapid, in-situ imaging and discrimination of key biomolecules based on their characteristic UV absorption signatures. This work establishes a viable route toward mass-producible, large-area biochemical analysis platforms, offering a promising alternative to current complex, label-dependent diagnostic methods.
Project Support
This work is supported by the National Natural Science Foundation of China (Grant Nos. 62174113, 12174275, 62404146 and 12574218) and Guangdong Basic and Applied Basic Research Foundation (2023A1515140094 and 2023A1515110730).
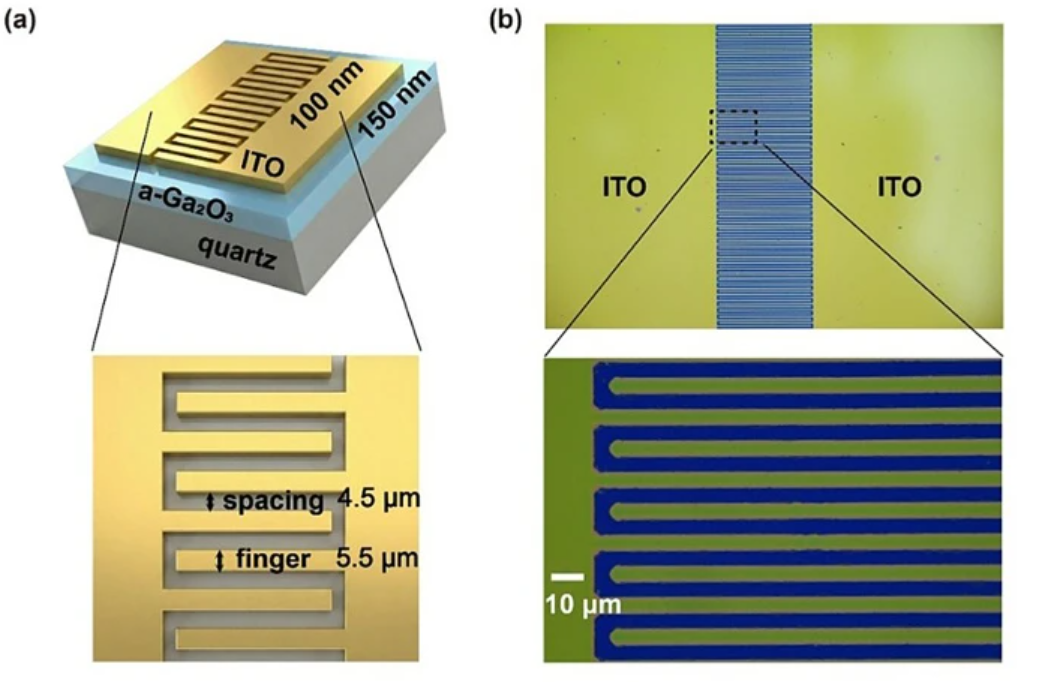
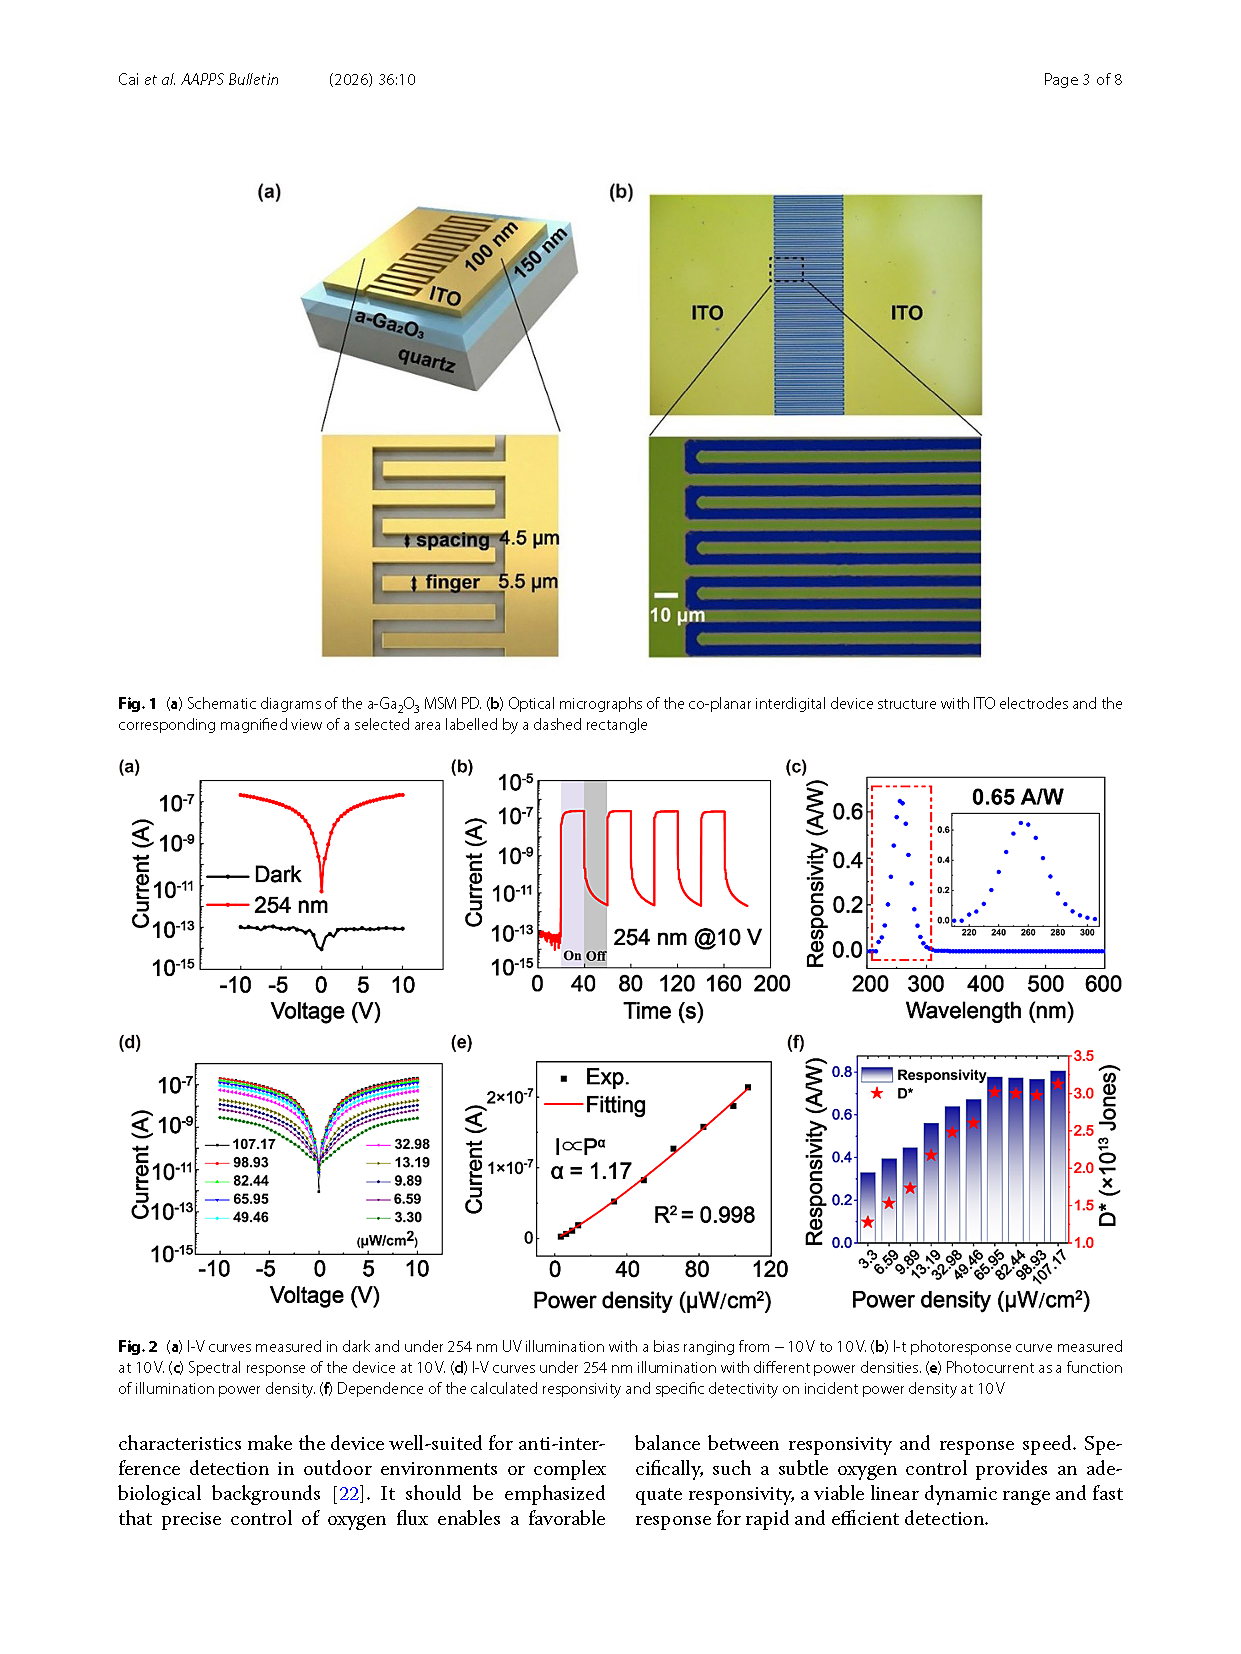
Fig. 1 (a) Schematic diagrams of the a-Ga₂O₃ MSM PD. (b) Optical micrographs of the co-planar interdigital device structure with ITO electrodes and the corresponding magnified view of a selected area labelled by a dashed rectangle.
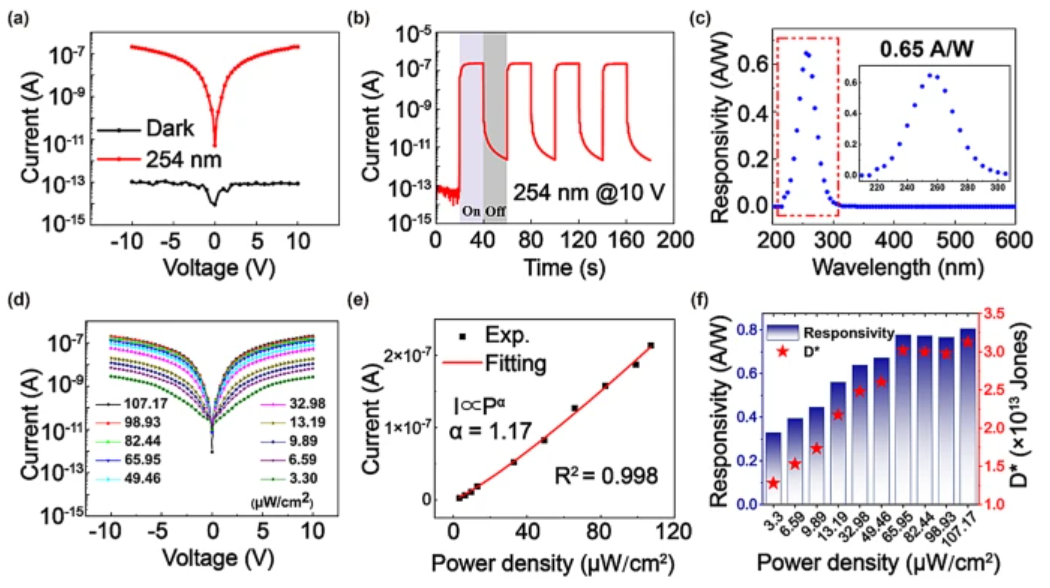
Fig.2 (a) I-V curves measured in dark and under 254 nm UV illumination with a bias ranging from − 10 V to 10 V. (b) I-t photoresponse curve measured at 10 V. (c) Spectral response of the device at 10 V. (d) I-V curves under 254 nm illumination with different power densities. (e) Photocurrent as a function of illumination power density. (f) Dependence of the calculated responsivity and specific detectivity on incident power density at 10 V.
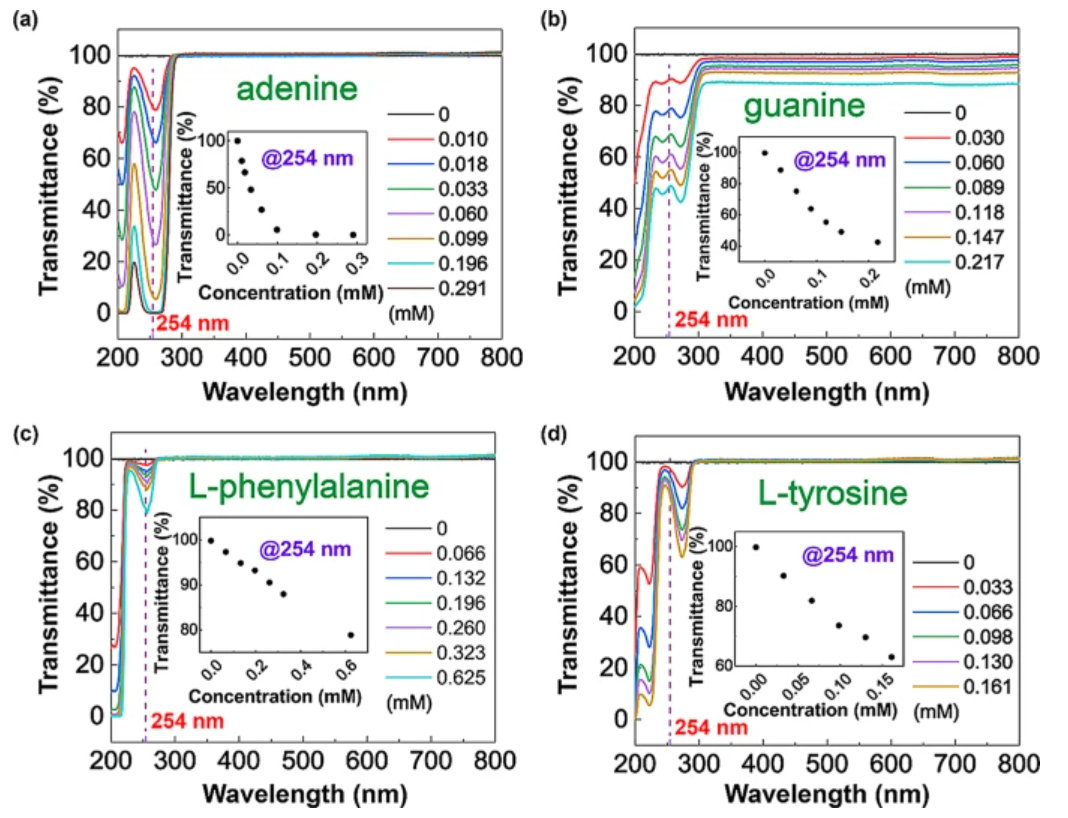
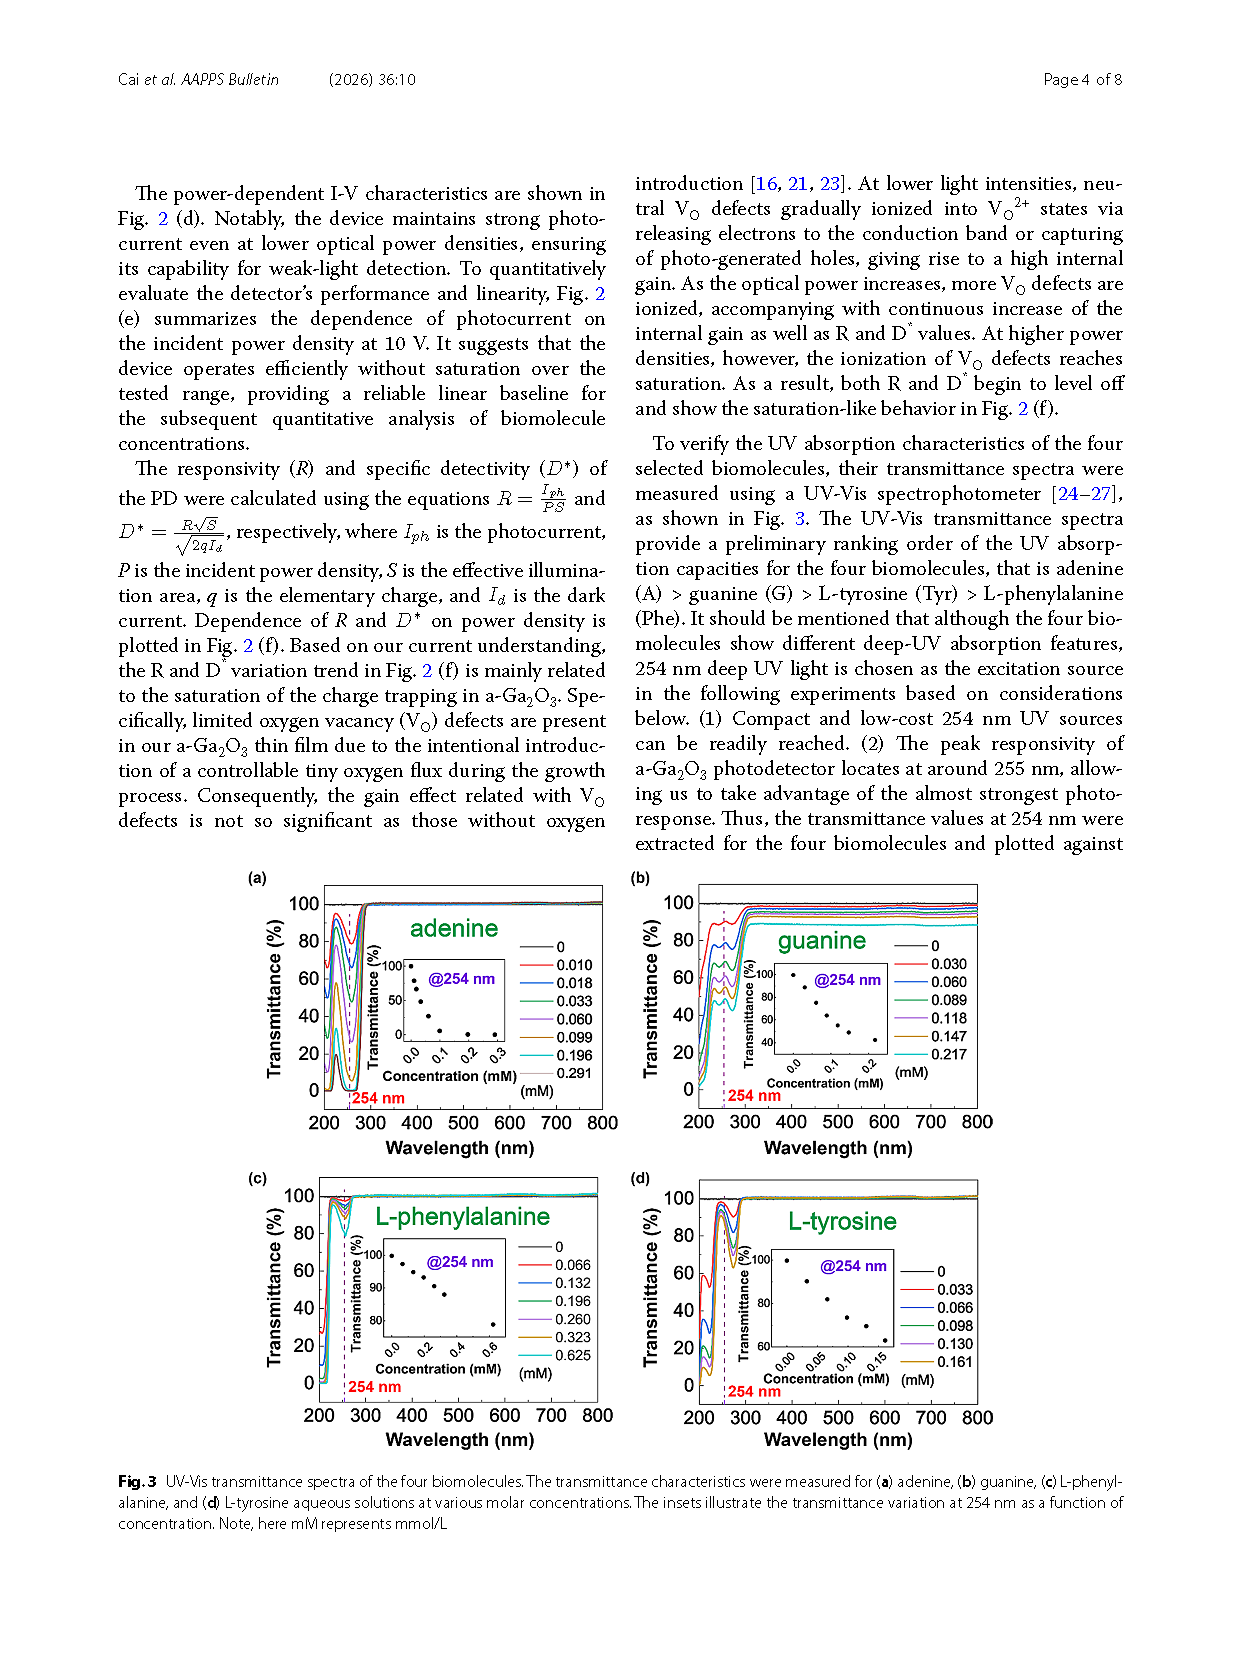
Fig.3 UV-Vis transmittance spectra of the four biomolecules. The transmittance characteristics were measured for (a) adenine, (b) guanine, (c) L-phenylalanine, and (d) L-tyrosine aqueous solutions at various molar concentrations. The insets illustrate the transmittance variation at 254 nm as a function of concentration. Note, here mM represents mmol/L.
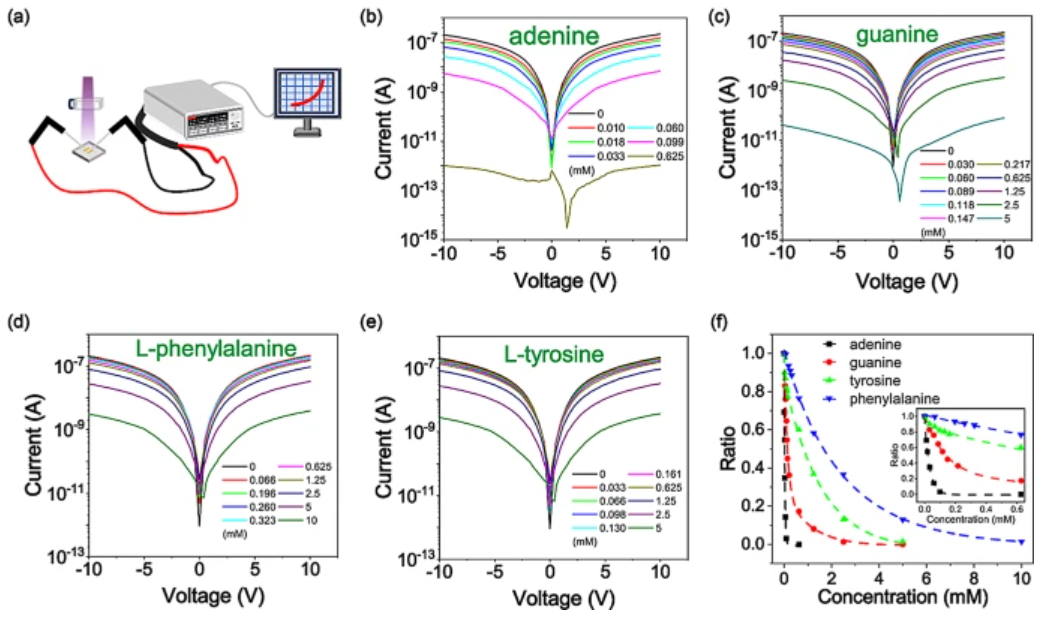
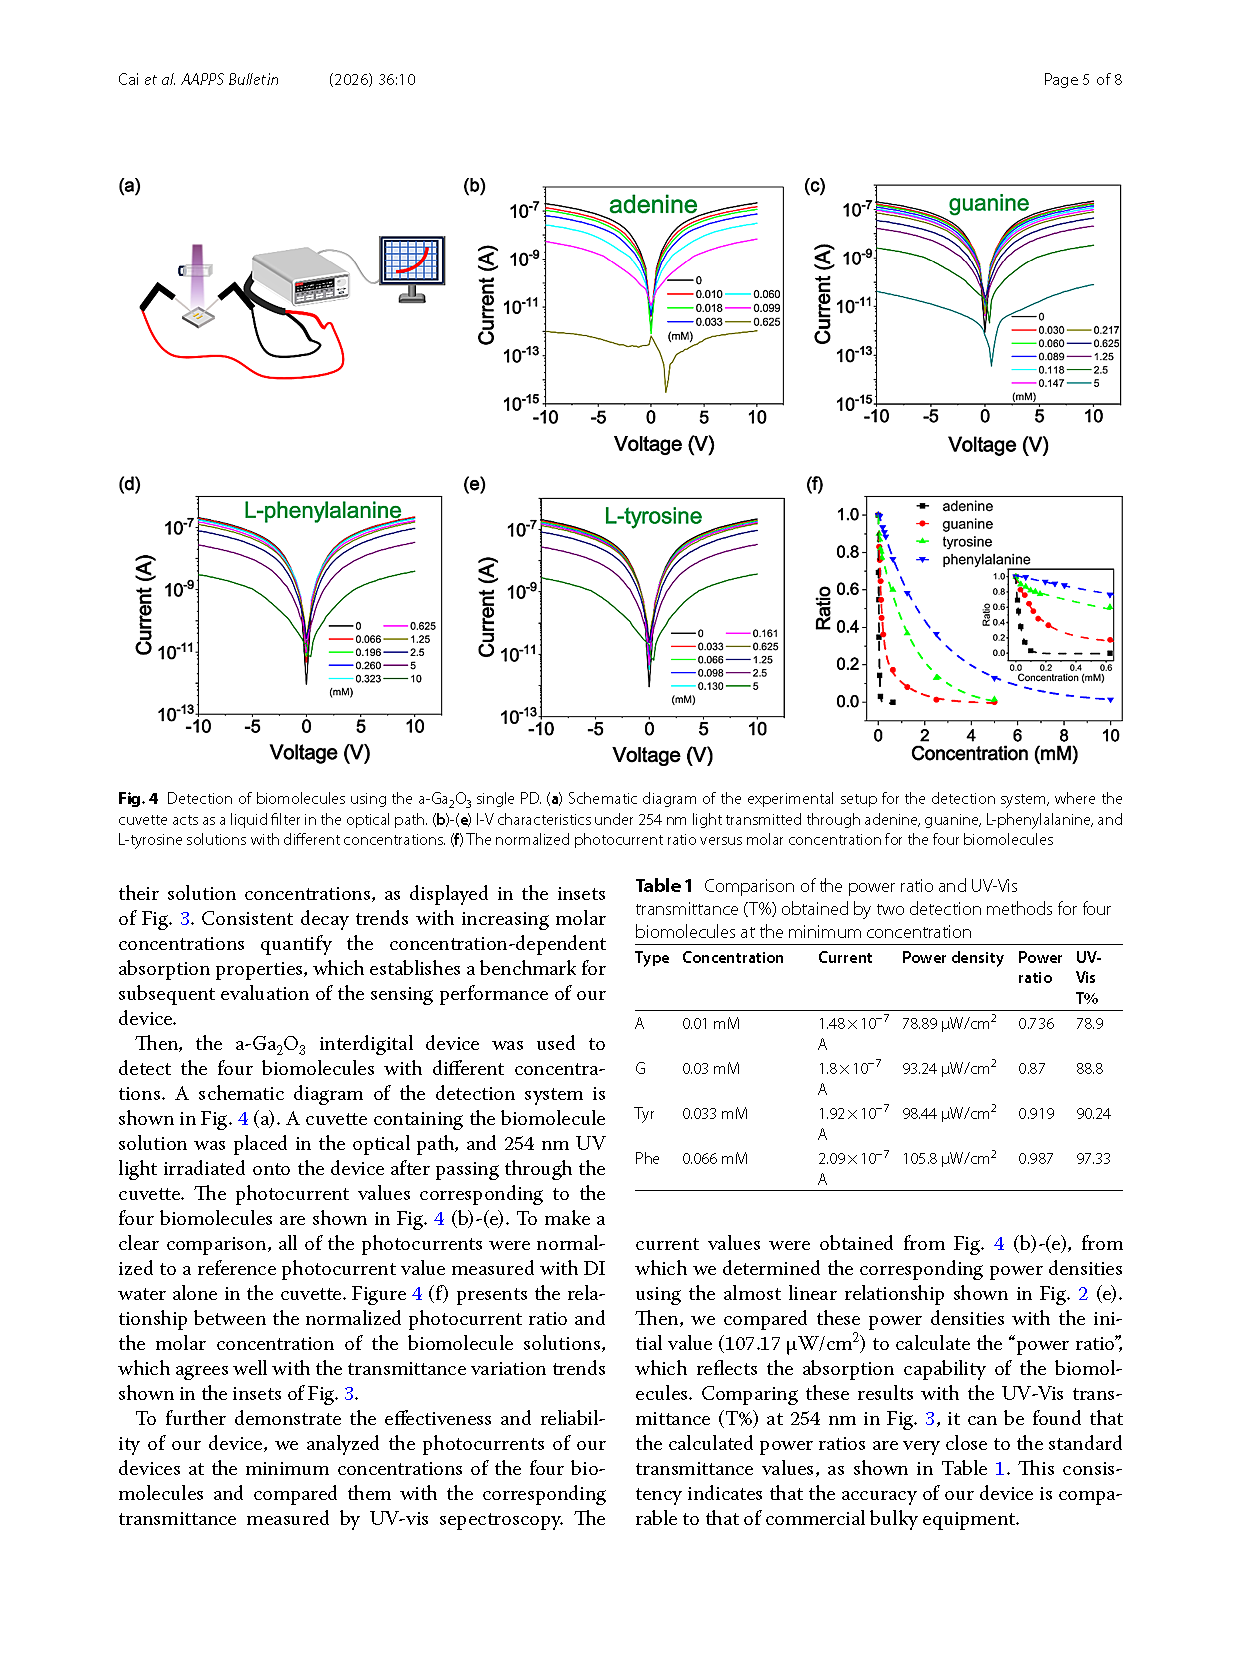
Fig.4 Detection of biomolecules using the a-Ga₂O₃ single PD. (a) Schematic diagram of the experimental setup for the detection system, where the cuvette acts as a liquid filter in the optical path. (b)-(e) I-V characteristics under 254 nm light transmitted through adenine, guanine, L‑phenylalanine, and L‑tyrosine solutions with different concentrations. (f) The normalized photocurrent ratio versus molar concentration for the four biomolecules.
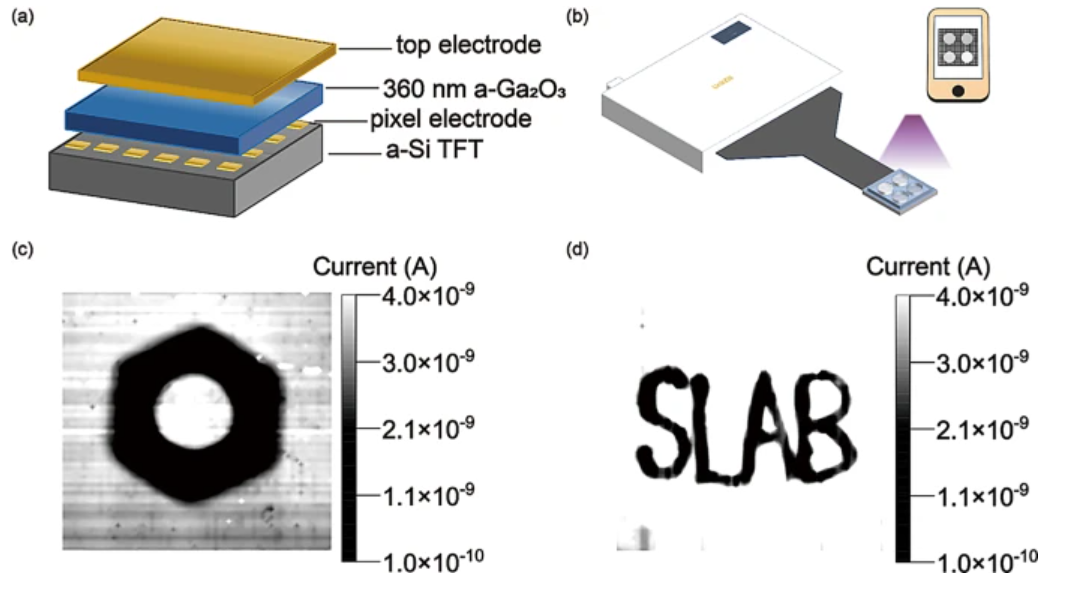
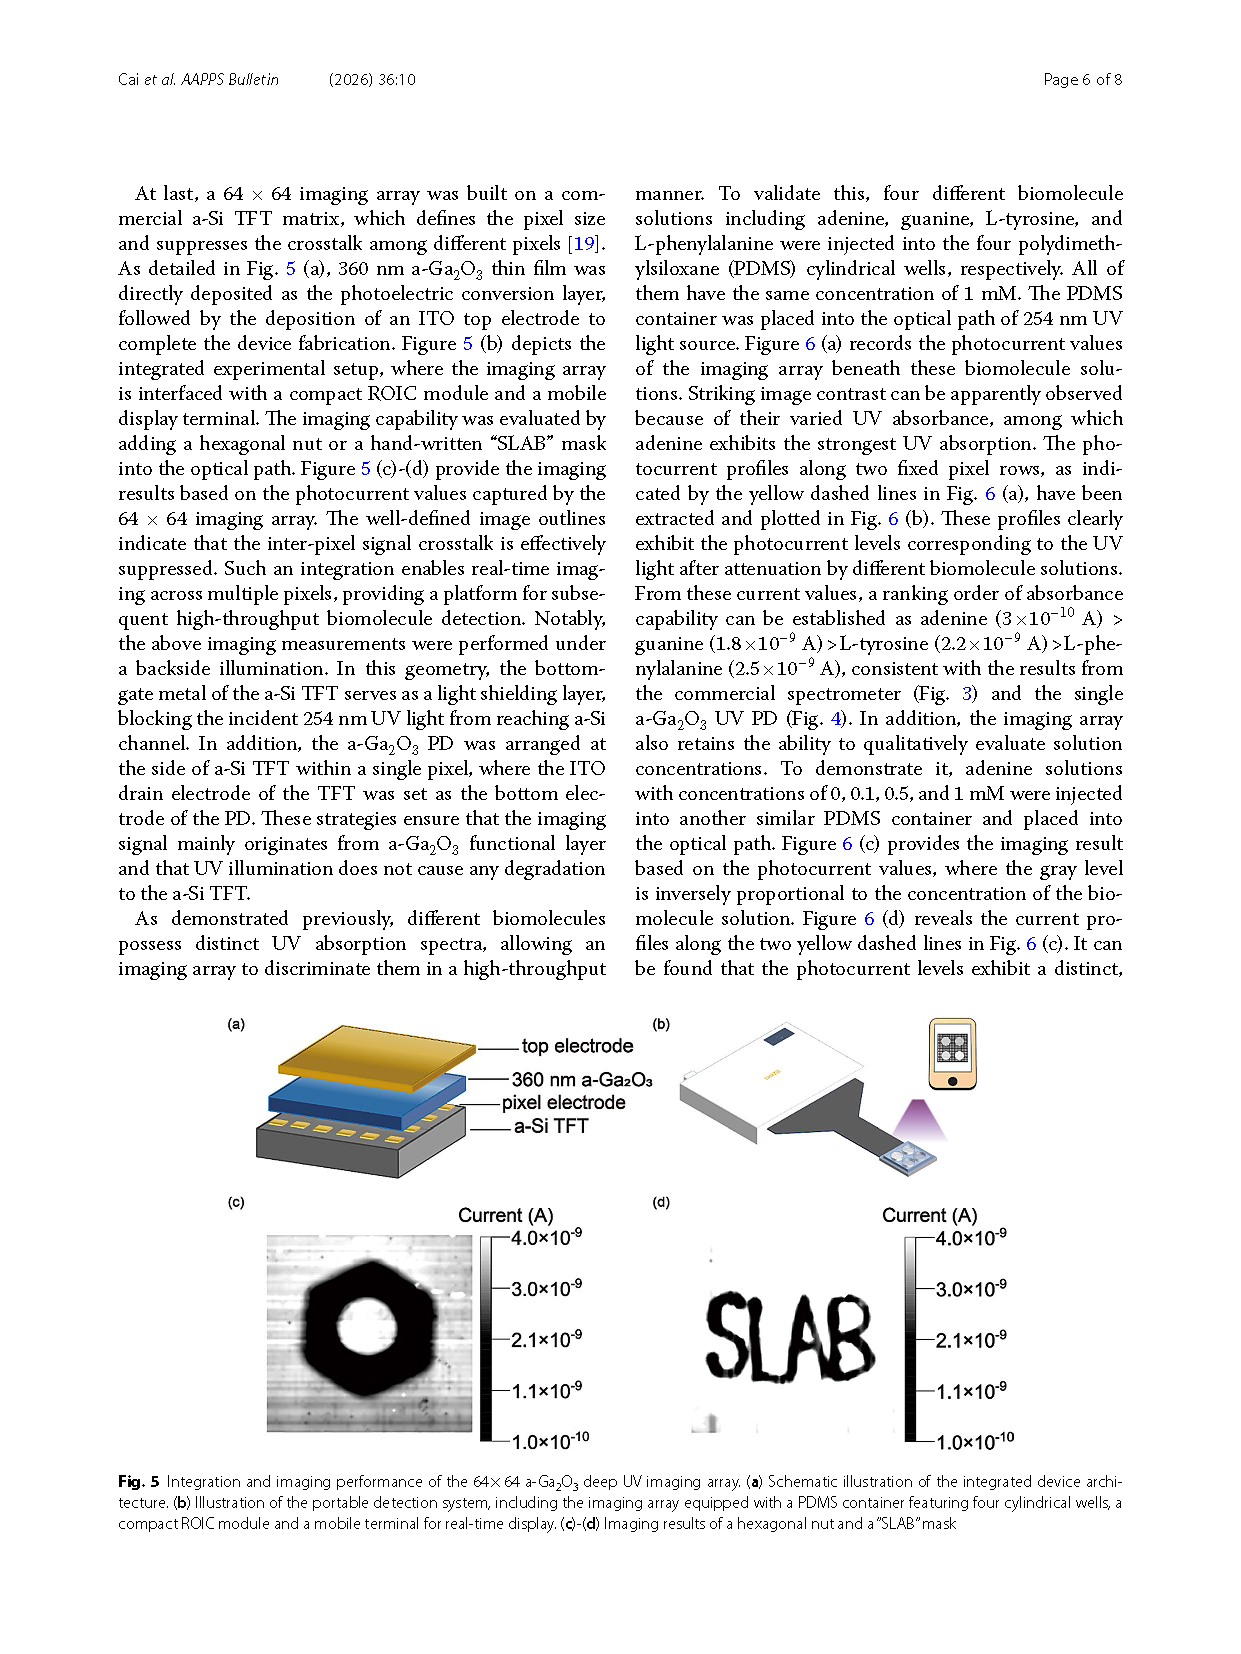
Fig.5 Integration and imaging performance of the 64 × 64 a-Ga₂O₃ deep UV imaging array. (a) Schematic illustration of the integrated device architecture. (b) Illustration of the portable detection system, including the imaging array equipped with a PDMS container featuring four cylindrical wells, a compact ROIC module and a mobile terminal for real-time display. (c)-(d) Imaging results of a hexagonal nut and a “SLAB” mask.
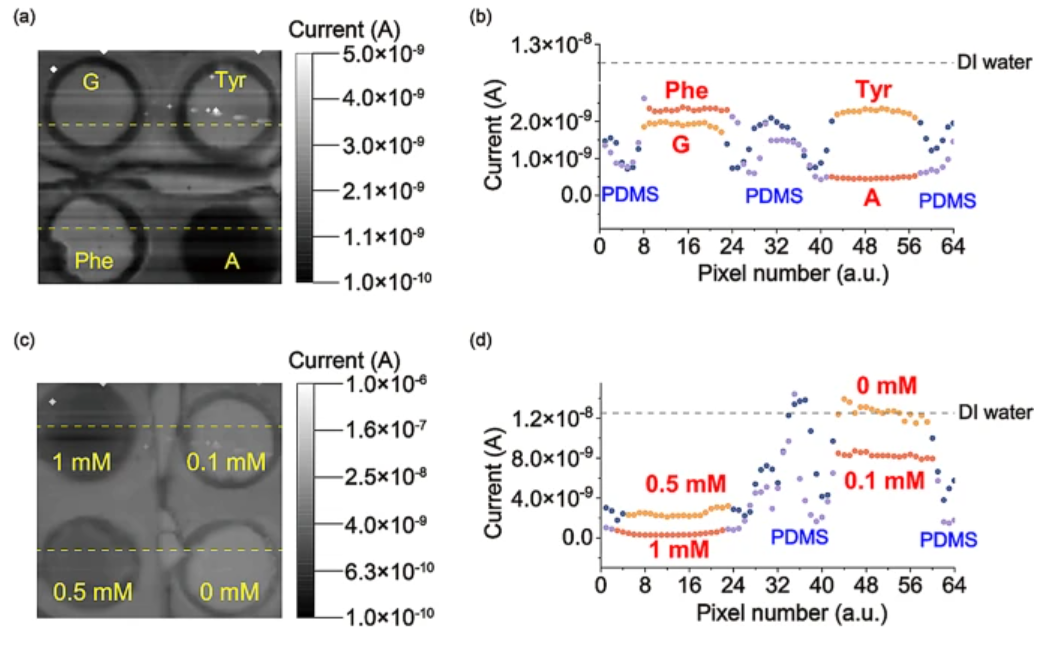
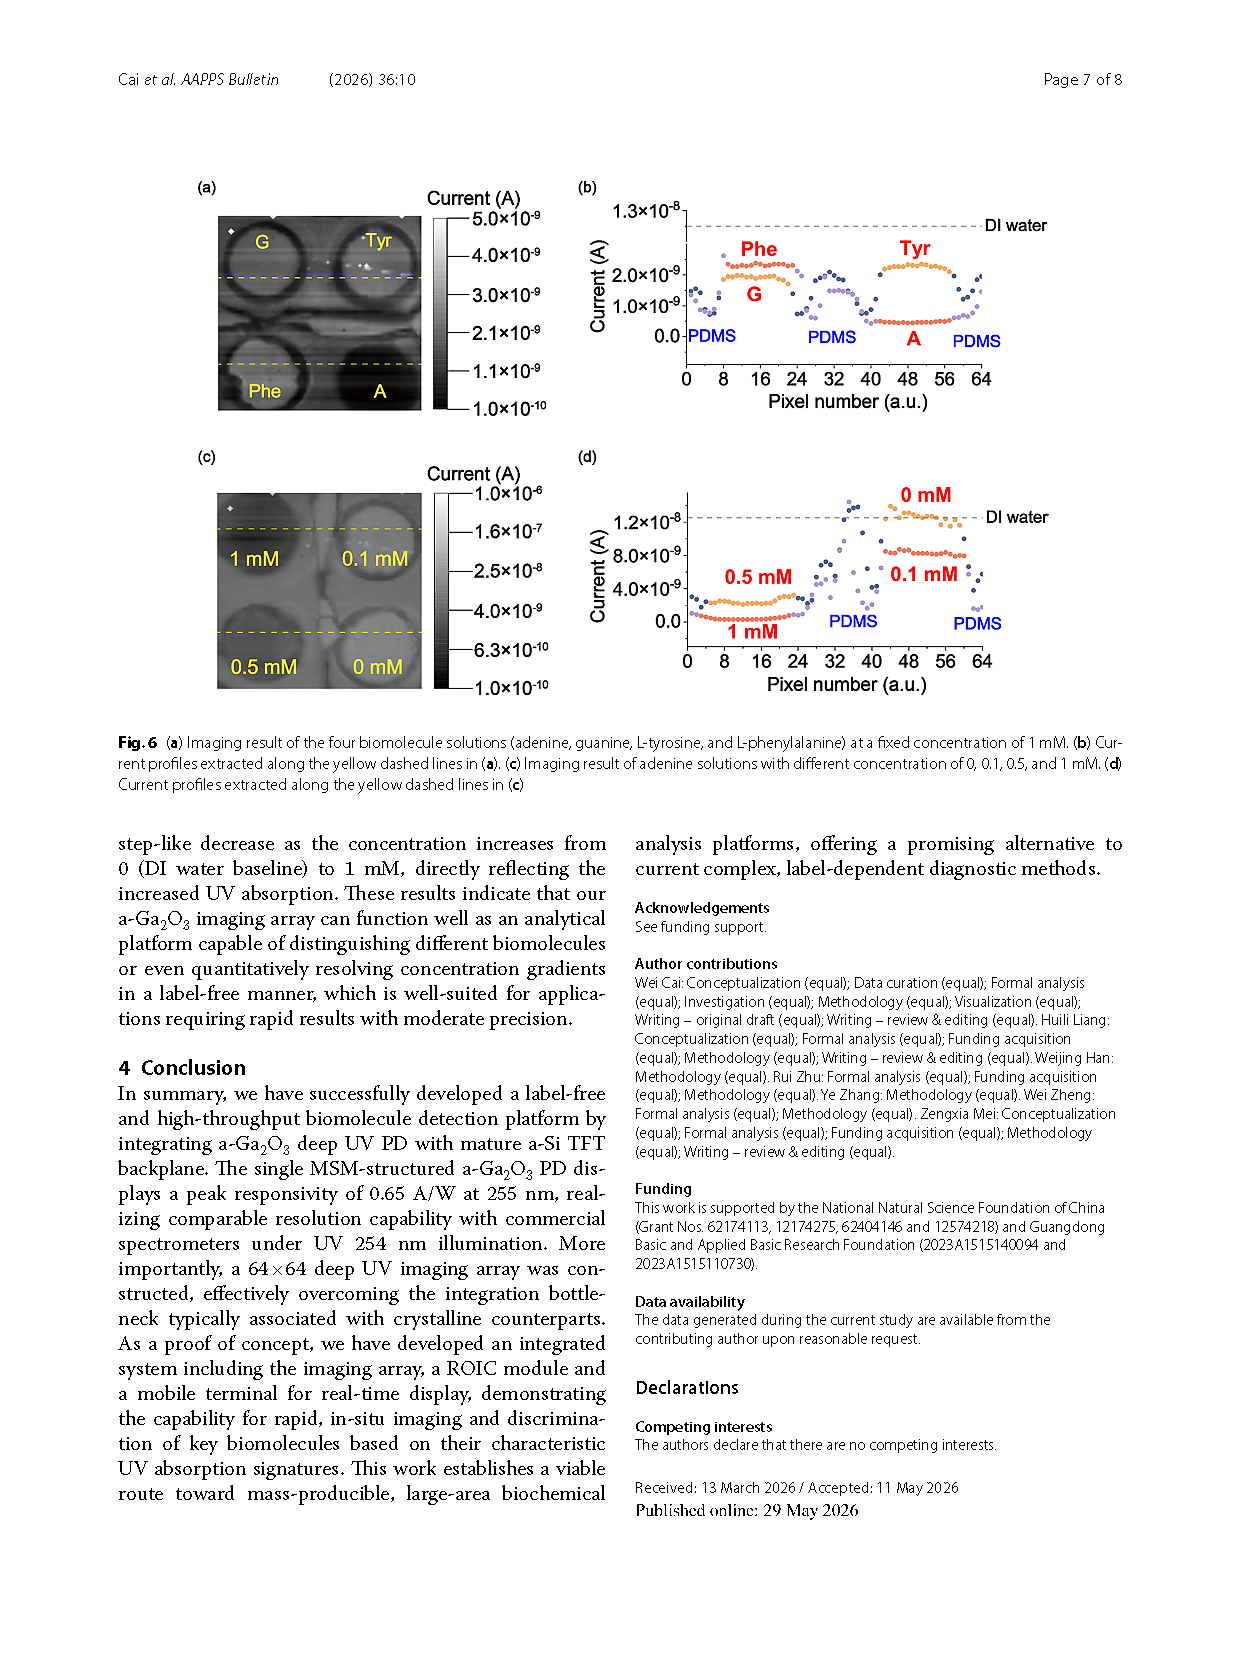
Fig.6 (a) Imaging result of the four biomolecule solutions (adenine, guanine, L-tyrosine, and L-phenylalanine) at a fixed concentration of 1 mM. (b) Current profiles extracted along the yellow dashed lines in (a). (c) Imaging result of adenine solutions with different concentration of 0, 0.1, 0.5, and 1 mM. (d) Current profiles extracted along the yellow dashed lines in (c).
DOI:
doi.org/10.1007/s43673-026-00190-0